

The $49 Billion Chocolate Fix
How pooled buyer contributions and sovereign debt swaps could close the billion dollar cocoa income gap for 1.2 million farming households

👋 Welcome to Climate Drift: your cheat-sheet to climate. Each edition breaks down real solutions, hard numbers, and career moves for operators, founders, and investors who want impact. For more: Community | Accelerator | Open Climate Firesides | Deep Dives
Hey there! 👋
Skander here.
You know how the chocolate industry tries to fix farmer poverty? One company pays a premium to its own supply chain. Another company pays a different premium to its own supply chain. Twenty programs running in parallel, each reaching a few thousand farmers, each with its own admin overhead, each covering maybe 2-3% of the problem.
Meanwhile, 1.2 million cocoa farming households in Côte d’Ivoire earn less than half of what they need to survive. When global cocoa prices quadrupled last year, exporters captured 68% of the windfall. Farmers’ incomes actually went down.
Dan Fullem is a Driftie from our most recent cohort. He spent 25 years in international corporate finance, managed SPVs with over $3 billion in power infrastructure assets, and helped take grid batteries from pilot to scaled procurement. He knows what it looks like when a system is stuck at "pilot" and what it takes to force the jump to "scaled."
He looked at the cocoa living income crisis and asked a different question: what if you calculated exactly how much each buyer benefits from a system where farmers stay poor, pooled those contributions into a single country-level fund, and used that pool to unlock sovereign debt financing?
The result is a detailed blueprint for a $49.1 billion public-private fund. It borrows a shared responsibility methodology from recent palm oil research, adapts it with cocoa-specific market data, and layers in debt-for-nature swaps modeled on what worked in Belize, Ecuador, and Gabon.
Today we’re looking at:
Why fragmented company-by-company premiums will never close a $4.91 billion annual gap (and the math that proves it)
How a “buyer responsibility coefficient” calculated from real forward contract data allocates fair contributions across exporters, processors, and manufacturers
The fund mechanics: how $1 of private sector money becomes $1.72 through sovereign debt swaps, MDB co-financing, and carbon markets
What the pilots (Tony’s Open Chain, Nestlé Income Accelerator, EnRoute) have proven works at small scale
A delivery system built on Village Savings and Loan Associations that reaches 100% of farmers from Year 1
Let’s get into it. 🍫
First: Who is Dan?
Dan is a project management professional and draws on his 25-year international corporate finance experience to drive change. He started his career in the early dot-com days before going on to a career in the international power sector where he worked to take grid-batteries from pilot to scaled large-scale procurement of grid-services.
He also mapped out how private companies can procure renewable powerpurchase agreements in markets where regulations were still developing. During this period, he was also responsible for the financial management of SPVs with over $3b of power infrastructure assets.Going forward, he will leverage his project management, finance and innovation experience at coalitions, NGOs and private companies looking to orchestrate systemic change within critical supply chains at the intersection of climate and social change: how to go from pilot to scaled impact.
Connect with Dan if this is something you are working to achieve www.linkedin.com/in/dan-fullem or directly at danfullem@gmail.com
The $49 Billion Chocolate Fix

What if I told you that every bar of chocolate you’ve ever eaten contains an invisible cost: the poverty of the farmers who grew the cocoa. In Côte d’Ivoire alone, 1.2 million farming households earn less than half of what they need to survive, leading to child labor prevalence rates around 50%. Despite years of premium payments, certifications, and pilot projects, 80.9% of cocoa farmers remain trapped below the living income threshold. The human crisis and climate change are tightly linked: this poverty is the root cause of West Africa’s deforestation crisis, as desperate farmers clear protected forests to expand cocoa production, the only lever they control to increase income.
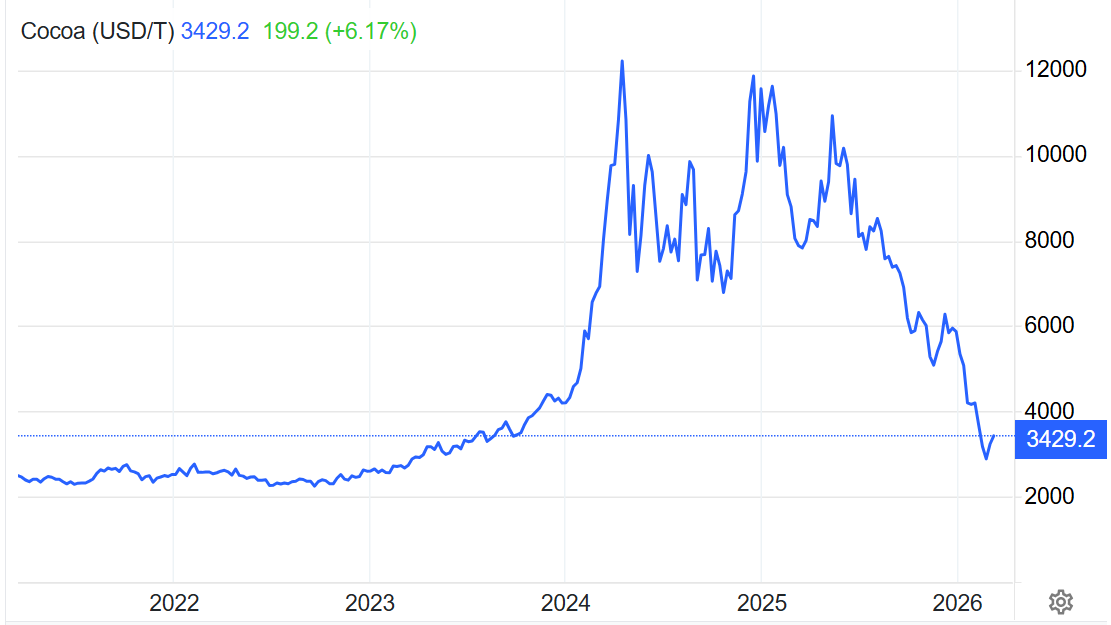
Tony’s Chocolonely’s 2025 impact report offered a glimmer of hope: 40.6% of their farmers reached the living income benchmark during the 2024/25 season—more than double the previous year’s 19.1%.1 But this masked a deeper problem. That season coincided with record farmgate prices. The Ivorian government raised the guaranteed price from 1,800 CFA francs/kg (€2.74) to 2,800 CFA/kg (€4.27)—a 56% increase—hoping to share global commodity market gains with farmers.2 Then the crisis hit. As global prices fell in late 2025, exporters (those buying from farmers) refused to buy at the government-set price.3 By early 2026, farmers were being forced to sell cocoa at 2,000 CFA/kg despite the official 2,800 CFA/kg farmgate price, while 123,000 tonnes sat unsold in warehouses.4 Farmers who briefly reached living income during the price spike now face a double crisis: falling effective prices and unsold inventory.
This volatility exposes the fatal flaw of market-dependent approaches: commodity price swings leave farmers on a rollercoaster between survival and destitution. The solution must provide stability regardless of global market conditions.
Global Cocoa Market Prices
The current approach isn’t working. Fragmented company-by-company premiums reach only 5% of farmers. The math is brutal: even a substantial $736/ton premium translates to just $854/year for a typical farmer, leaving a $4,047 income gap (with the updated 2025 living income benchmark of $6,850/year). And that’s for the lucky few in certified supply chains. The other 95%? No path forward.
But what if there’s a better way? What if, instead of each company paying premiums for their own supply chain, contributions were pooled based on shared responsibility (how much each buyer benefits from a system where living income costs are externalized) and leveraged to unlock sovereign-scale financing?
Recent research on palm oil supply chains demonstrates a method for calculating fair, science-based allocations of responsibility between buyers and sellers. Applied to cocoa, combined with innovative debt-for-nature financing, this framework could close the entire $4.91 billion annual gap.
The critical insight: Instead of working against the existing system, the fund keeps the existing cocoa trade infrastructure completely unchanged—cooperatives, exporters, processors, and government price-setting all continue exactly as today. It creates a parallel supplement system delivered directly to farmers through Village Savings and Loan Associations (VSLAs), a proven community-led model reaching 30 million people globally. This means 100% coverage from Year 1 without waiting for regulatory reform, political battles, or market restructuring. By Year 10, the supplement system builds sufficient capacity to transition to permanent Living Income Reference Pricing and sustained productivity gains.
Here’s the journey I’m taking you on today:
Part 1: I’ll trace the living income crisis from individual farming households to country-level calculations, using real data to show why current approaches fall short.
Part 2: I’ll introduce a shared responsibility framework with a cocoa-specific buyer responsibility coefficient, showing how to calculate fair buyer contributions and why pooling them changes everything. This will cover $2.86 billion annually (58.26% of the total income gap).
Part 3: I’ll design a $49.1 billion public-private fund that leverages debt-for-nature swaps to multiply private sector contributions 1.7x, creating a mechanism that works at scale to cover 100% of the income gap.
This is about more than cocoa. It’s a blueprint for transforming how to address living wages and environmental protection across all agricultural commodities, from coffee and tea to palm oil to coconuts.
Will there be challenges in implementation? Absolutely. Payment delivery inefficiencies, coordination hurdles, and unforeseen complications are inevitable when operating at this scale. But any inefficiency in this system should be measured against the profound inequalities embedded in the status quo—where farmers capture 8.75% of retail value in normal years and see their incomes decline 11% when global prices quadruple. The question isn’t whether this fund will be perfect, but whether it’s better than a system designed to exclude farmers from economic surplus. Every challenge encountered becomes a learning that strengthens the model for replication across other commodities.
Let’s dive in.
PART 1: The Root of the Problem - Following the Money to the Farm Gate
The Invisible Crisis in Your Supply Chain
The numbers are staggering:
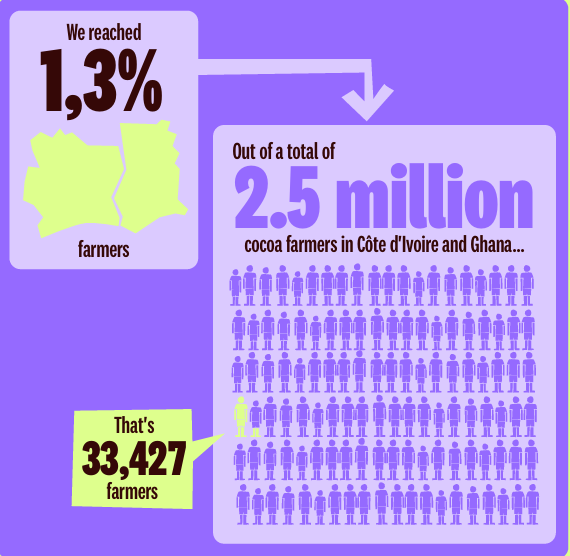
2.5 million cocoa smallholder farmers in Côte d’Ivoire and Ghana
Supporting 40-50 million people globally through the cocoa value chain5
60% of the world’s cocoa comes from these two countries6
Côte d’Ivoire alone: 1.5 million farming households producing 40% of global cocoa
But here’s what those numbers hide: widespread, systematic poverty.
The connection between living wage deficits and environmental destruction isn’t abstract. It’s cause and effect. When cocoa farmers can’t earn enough to feed their families, they make desperate choices: clearing protected forests for new plots, pulling children out of school to work on farms, abandoning cocoa farming entirely and migrating to cities.
Côte d’Ivoire has lost 90% of its forest cover over the past 30 years, with cocoa expansion a leading driver.7 Ghana has lost 65%.8 Child labor affects 1.56 million children in cocoa-growing regions.9
These aren’t separate crises; they’re symptoms of the same structural problem: cocoa farmers are systematically underpaid for their labor, and the costs of that underpayment (poverty, deforestation, child labor) are externalized onto farming communities and the environment.
A Case Study: Côte d’Ivoire’s Living Income Gap - Built from Farm-Level Reality
To understand the true scale of the challenge, the analysis needs to start with what’s actually happening on cocoa farms, not theoretical models. Tony’s Open Chain, one of the most transparent initiatives in the sector, collected detailed data across their Côte d’Ivoire supply chain that reveals the gap between ideal assumptions and farmer realities.
Farm-Level Data Points:10
Average farm size: 2 hectares (not 4.4 ha assumed by benchmark models)
Average yields: 580 kg/ha (not 800 kg/ha assumed by models)
Median household size: 6 people (not 8 assumed by models)
Labor costs: 63% hire labor brigades (models assume unpaid family labor)
Income diversification: 40% from non-cocoa sources (models assume 25%)
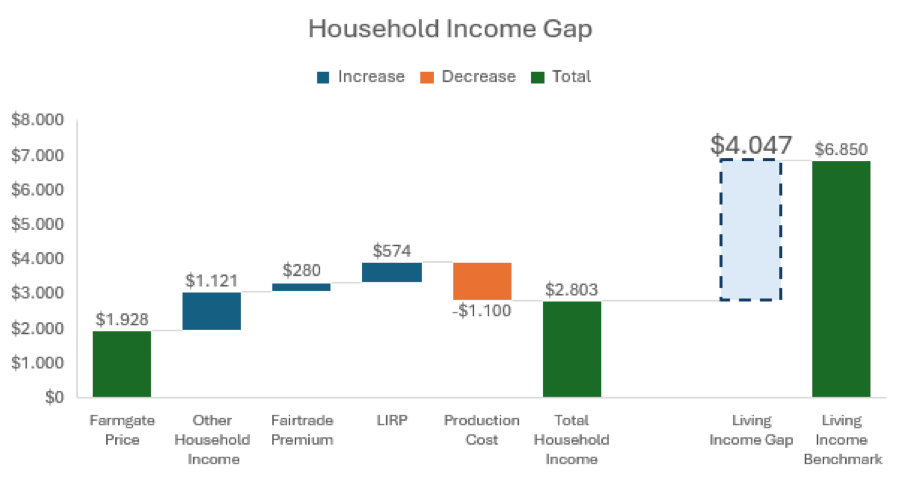
Let’s calculate what this means for a typical cocoa farming household:
Annual Gross Cocoa Income:
Farm size: 2 ha
Yield: 580 kg/ha
Total production: 1,160 kg (1.16 tons)
LIRP price: $2,398/ton11
Farmgate: $1,662/ton
Fairtrade premium: $241/ton
Living Income premium: $495/ton
Gross cocoa revenue: $2,782
Deduct Production Costs:
Inputs (fertilizer, pesticides): -$400
Hired labor (63% of farmers): -$500
Other farming costs: -$200
Net cocoa income: $1,682
Total Household Income (including other sources):
Net cocoa income: $1,682 (60% of total)
Other income sources: $1,121 (40% of total)
Total annual household income: $2,803
Living Income Benchmark for Côte d’Ivoire:12
Source: Anker methodology, updated in Tony’s Chocolonely 2025 Impact Report
Household size: 6 people
Monthly: 348,258 CFA Francs (€531)
Annual benchmark: $6,850/year (€6,371)
The Income Gap:
Gap amount: $4,047 per household
Gap as percentage: 59.1% below living income
This aligns with Tony’s updated 2025 findings showing that 59.4% of farmers at their three long-term partner cooperatives remain below the living income benchmark, with most earning between 61-99% of the target.
Scaling to the Country Level:
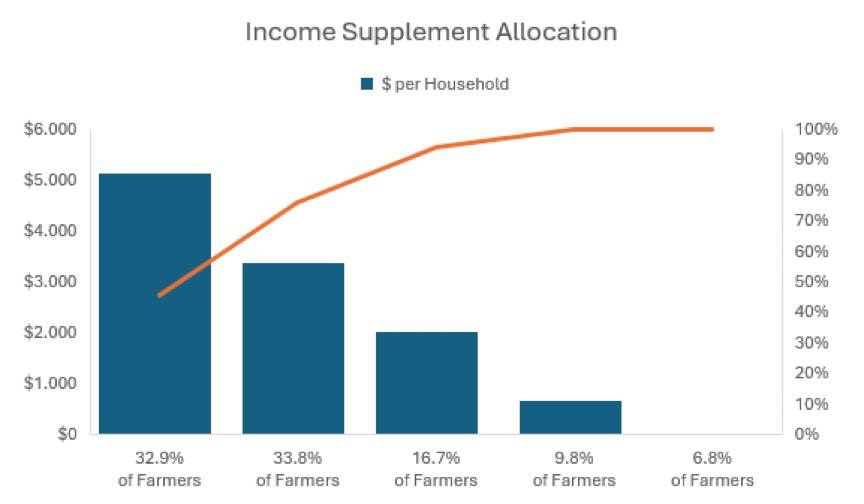
Rather than assuming the average income gap applies to everyone, let’s use a progressive, distribution-weighted allocation based on where farmers sit on an income spectrum:
Income Distribution & Supplement Allocation:
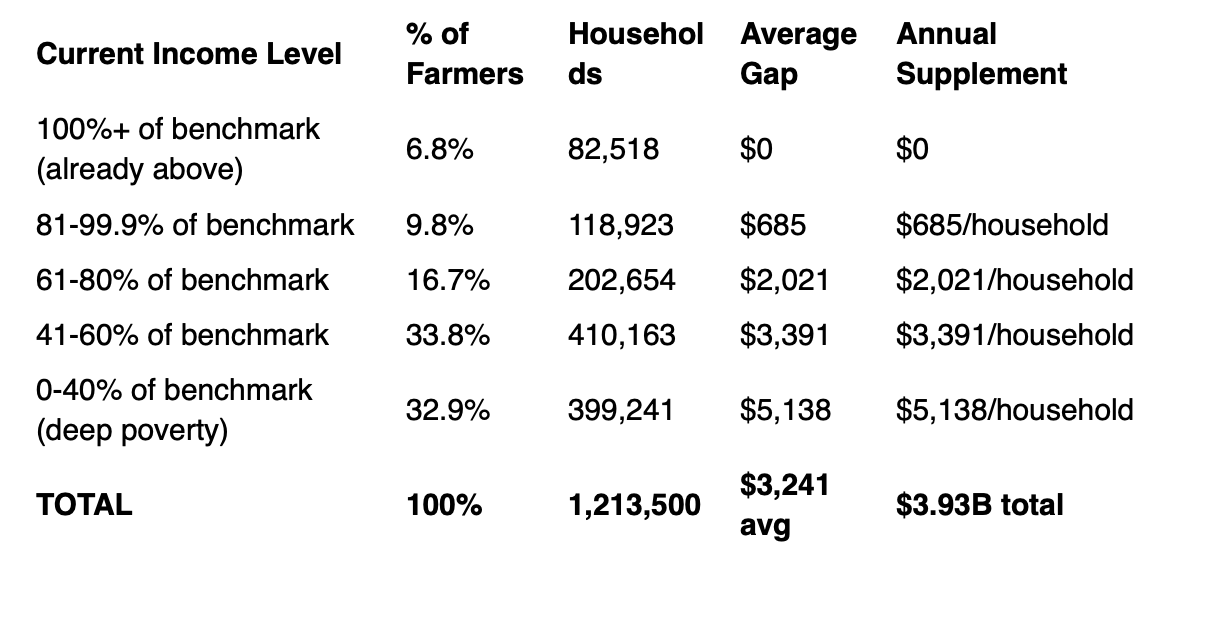
Distribution methodology: Based on synthesis of Tony’s Chocolonely 2025 report (19.1% at living income in premium cooperatives), Fairtrade 2021 household income study, and WUR research showing 73-90% below living income threshold. General population distribution is more concentrated in poverty than premium cooperative samples.
Result: Progressive targeting ensures the poorest third of farmers (0-40% band) receive the largest supplements ($5,138/year), while those already near the threshold receive smaller top-ups.
Total Annual Living Income Gap for Côte d’Ivoire: 1,213,500 households × $3,241 average gap = $3.93 billion/year in direct income support
The $3.93B annual living income support allocation closes 100% of income gaps for all 1,213,500 households.
This is the system-level deficit that needs closing. It’s not a rounding error; it’s half of Côte d’Ivoire’s annual cocoa export revenues ($6-8 billion) and reflects the updated 2025 living income benchmark of $6,850/year.
What the Pilots Have Proven
Four major programs validate components of the solution
Over the past five years, four major initiatives have tested different approaches to closing the living income gap and reducing child labor in cocoa supply chains. Together, they’ve reached approximately 60,000 households and generated rigorous evidence about what works—and what doesn’t.
Tony’s Open Chain: Premium pricing works, but scale is the barrier
Tony’s Open Chain represents the industry’s most ambitious premium pricing model. Founded on the mission to make chocolate 100% exploitation-free, Tony’s Chocolonely created the Open Chain model in 2018 to share their sourcing practices with the broader industry. Today, 20 Mission Allies (including major food companies) have joined the initiative, working with three long-term partner cooperatives in Côte d’Ivoire.
What makes Tony’s revolutionary:
Pays Living Income Reference Prices for 5+ consecutive years: industry-leading rates that go far beyond Fairtrade minimums
Long-term partnerships with cooperatives, providing stability and trust
Comprehensive support systems including training, productivity investments, and farmer services
Radical transparency publishing detailed impact data annually, including failures alongside successes
Reaching 32,133 farming households through their supply chain (2024/25 season)
Nestlé Income Accelerator: Conditional cash + comprehensive support
Nestlé launched its Income Accelerator Program in 2022, now reaching over 30,000 cocoa farming households across Côte d’Ivoire and Ghana. The program works with eight supplier companies—Cargill, ETG/Beyond Beans Foundation, Olam Food Ingredients (ofi), Barry Callebaut, ECOM, So-b-green, Sucden, and Touton—demonstrating private sector collaboration at scale. Partners include the International Cocoa Initiative (ICI), Rainforest Alliance, and IDH.
The program offers four conditional components: school enrollment cash transfers (EUR 100/year), subsidized pruning brigades (EUR 100), agroforestry support with 20+ shade trees (EUR 100), and income diversification through GALS (Gender Action Learning System) training, VSLAs (Village Savings and Loan Associations), and EUR 100 for women’s income-generating activities. Maximum total: EUR 500 over first two years, EUR 250 in subsequent years if conditions met.
The KIT Royal Tropical Institute’s rigorous evaluation found significant impacts after 30 months: 18% higher cocoa yields (+79 kg/ha), 26% higher cocoa revenue (+$648), 63% higher VSLA membership among spouses, 105% higher savings (+$68), 45% lower food insecurity (-12 percentage points), and 18% improvement in women’s empowerment index.13
Critical finding: Cash transfers were the mechanism driving resilience. Econometric analysis showed cash enabled farm investments, improved food security, increased savings, and promoted women’s empowerment—with a positive relationship between amount received and effect size.14
EnRoute Program: Testing integrated approaches
The ETG-Beyond Beans Foundation, with Oxfam Novib and KIT, ran a randomized experiment (2023-2025) across 599 households in Daloa and Man regions, testing three intervention packages: Cash Only (EUR 400 unconditional transfer + intensive EBDM training), Services Only (subsidized pruning, agroforestry, VSLAs, GALS training), and Cash & Services combined.
All three packages improved cocoa production and household income, but through different pathways. Cash Only was most effective for immediate liquidity relief, with school expenditure per child rising 272% and EBDM training improving spousal communication and reducing domestic conflict. Services Only had the strongest impact on long-term productivity and gender equity through GALS training and VSLA participation. Cash & Services showed the widest range of impacts across 11 outcome domains, with strongest effects on adaptive capacity, financial inclusion, and women’s empowerment—suggesting integrated models build long-term resilience.15
Tony’s Open Chain demonstrates that comprehensive, long-term approaches can dramatically reduce child labor. At their three longest-term partner cooperatives (harvesting stage), child labor prevalence fell to just 3.9%—compared to industry averages around 50%. This wasn’t achieved through cash transfers alone, but through integrated Child Labor Monitoring and Remediation Systems (CLMRS), LIRP payments, long-term commitments, and community-level support including schools, water infrastructure, and healthcare facilities funded through the Chocolonely Foundation.16
ICI Gender & Financial Inclusion Study: Who receives the cash matters
The International Cocoa Initiative’s 2023-2025 study in Ghana tested whether cash transfers have different impacts when paid directly to women, and how combining cash with GALS and VSLA changes outcomes.17
Critical findings: When women received cash + GALS + VSLA, they gained greater decision-making power, financial independence, and social status. When men received it, farm investments increased but women’s empowerment remained static. The combination of GALS + VSLA significantly improved equitable household decision-making beyond cash alone.18
VSLAs emerged as critical infrastructure across all programs. These community-led savings groups provided financial access where formal banking is absent, created social capital and mutual support networks, enabled women’s economic participation, and built household resilience against shocks. When combined with cash transfers and GALS training, VSLAs transformed from simple savings mechanisms into platforms for economic empowerment and gender equity.
2025 Price Volatility: Why Market-Dependent Solutions Leave Farmers Vulnerable
The 2024/25 season exposed a critical vulnerability in all market-dependent approaches. Tony’s 2025 impact report showed 40.6% of farmers reached the living income benchmark—more than doubling the previous year’s 19.1%. This validates that the Living Income Reference Price model works when combined with comprehensive support.
But this progress coincided with record farmgate prices. The Ivorian government raised the guaranteed price from 1,800 CFA francs/kg (€2.74) to 2,800 CFA/kg (€4.27)—a 56% increase—hoping to share global commodity market gains with farmers.2 Then the crisis hit. As global prices fell in late 2025, exporters (those buying from farmers) refused to buy at the government-set price.3 By early 2026, farmers were being forced to sell cocoa at 2,000 CFA/kg despite the official 2,800 CFA/kg farmgate price, while 123,000 tonnes sat unsold in warehouses.4
Understanding who actually benefits from price surges: The structural capture of windfall profits
To understand why price volatility devastates farmers while enriching intermediaries, we need to trace how value flows through the cocoa supply chain and who captures windfalls when global prices spike.
Standard market payment flow (before the 2024 price spike):
The cocoa trade operates through Côte d’Ivoire’s regulated system. The Conseil du Café-Cacao (CCC) pre-sells 70-80% of the national harvest through forward contracts in September/October, locking in prices around $3,500/ton. The government then sets the farmgate price at 60% of this forward contract price—approximately $2,100/ton. Farmers sell to cooperatives at this fixed price, cooperatives deliver to licensed exporters, who ship to processors and ultimately chocolate manufacturers.
In a normal year, value distribution looks like this: Farmers receive $1,660/ton for their beans (earning ~$700 profit after $800 in labor and input costs). Cooperatives add a $140 margin for aggregation. Exporters purchase from cooperatives at $1,800 plus $200 in export taxes, then sell internationally at $3,500/ton—capturing a $1,200 margin. Processors buy beans at $3,500 and sell cocoa butter, powder, and liquor for $5,000/ton ($1,500 margin). Manufacturers then transform these into chocolate products sold at retail for $8,000+/ton.
Of the $8,000 total retail value created, farmers capture just $700 (8.75%).
What happens when global prices surge 380% (April 2024: $2,500 → $12,000/ton):
The forward contract system creates a massive arbitrage opportunity for exporters while completely excluding farmers from windfall gains. Here’s how:
In September 2023, exporters obtained licenses from the CCC based on forward contracts at $3,500-4,000/ton. The government set the farmgate price at 60% of these forwards: approximately $2,100/ton for the entire main season (October 2023-March 2024). This price was locked in—farmers could not negotiate and had no mechanism to benefit from future price movements.
By April 2024, global cocoa futures hit $12,000/ton (a 380% increase from the previous year) due to supply shortages from climate damage and disease. But the forward contract system meant exporters had already committed to deliver 70-80% of their inventory at $3,500-4,000/ton. Crucially, the remaining 20-30% could be sold at spot market prices.
The exporter windfall calculation:
Consider a major exporter (Barry Callebaut, Cargill, or Olam) with a 500,000-ton annual position:
70% forward-sold (350,000 tons): Purchased from cooperatives at $2,100/ton, sold via forward contracts at $3,500/ton = $1,400/ton margin = $490M profit
30% spot sales (150,000 tons): Purchased from cooperatives at $2,100/ton (same farmgate price!), sold at spot market $12,000/ton = $9,900/ton margin = $1.485B profit
Total profit: $1.975B (vs. $600M in a normal year) = 3.3x windfall
Meanwhile, the typical farmer experienced this:
Production declined 20% due to adverse weather and disease: 1.16 tons → 0.93 tons
Main season sales (75% of annual production): 0.70 tons × $1,637/ton = $1,145
Mid-season sales (25% of production): 0.23 tons × $2,455/ton = $565 (government finally raised price in April 2024, but only for the smaller mid-crop)
Total annual income: $1,710 (vs. $1,926 in a normal year)
When global prices increased 380%, farmers’ income declined 11%.
The $9,500/ton additional value created by the price spike was distributed as follows:
Exporters captured: $6,500/ton (68% of windfall)—buying at locked farmgate prices, selling 20-30% at spot
Processors captured: $4,000/ton (42%)—charging higher prices for cocoa butter/powder
Speculators captured: 380% returns—hedge funds betting on futures contracts
Manufacturers: $2,000/ton (21%)—partially hedged, passed costs to consumers
Farmers received: $340/ton (3.6%)—and only in mid-season when government belatedly raised prices
Why exporters refused to buy at the raised farmgate price (October 2025):
By October 2025, the government attempted to share windfall gains with farmers by raising the farmgate price to 2,800 CFA/kg ($4,581/ton)—a 56% increase. But global prices had already begun falling (down to $7,000-10,000/ton from the $12,000 peak). Exporters who had forward-sold most of their inventory at $3,500-4,000/ton now faced a devastating calculation:
Must pay farmers: $4,581/ton (government-mandated)
Forward contracts pay them: $3,500-4,000/ton
Loss per ton: $581-1,081
Their rational response: refuse to purchase. The result was 123,000 tonnes of unsold cocoa accumulating in cooperative warehouses, farmers forced to sell at unofficial prices of 2,000 CFA/kg ($3,273/ton) despite the official guarantee, and a government buy-back scheme costing 280 billion CFA francs.
The structural mechanisms that exclude farmers from price upside:
Three features of the CCC-regulated system ensure exporters capture windfalls while farmers absorb all downside risk:
The forward contract lock-in: Farmgate prices are set based on forward contracts signed months before harvest, not spot market conditions. When global prices spike mid-season, the farmgate price cannot adjust. Farmers sell at the pre-determined price while exporters sell their non-contracted portion at spot prices.
Bi-annual price setting with 6-18 month lags: The government sets farmgate prices only twice per year (October for main season, April for mid-season). The April 2024 price spike took 18 months to meaningfully reach farmers (October 2025 price increase), by which time global prices were crashing.
Exporter veto power: Exporters can simply refuse to buy when the farmgate price exceeds their forward contract proceeds. Farmers cannot store cocoa long-term (lacking infrastructure and facing spoilage), cannot access spot markets directly, and cannot negotiate. They must sell immediately at whatever price they can get.
This is not a market failure—it’s how the market was designed. The forward contract system serves exporters’ need for price hedging and risk management. The 60% farmgate formula ensures government export tax revenue. The bi-annual price setting provides administrative simplicity. Farmers’ exclusion from windfall gains is a feature, not a bug.
Farmers who briefly reached living income during the price spike are now falling back. The 40.6% success rate was achieved during an unsustainable commodity boom. Even at peak prices, 59.4% of farmers at Tony’s three long-term partner cooperatives remained below the benchmark, with most earning 61-99% of the target.
Nestlé’s program experienced similar volatility impacts. Despite higher cocoa prices compensating for lower production volumes in 2023/24, farmers became more dependent on cocoa (59% vs 52% income share), making them more vulnerable to future price crashes.
What this means: Even best-in-class programs—Tony’s premium pricing, Nestlé’s conditional cash, EnRoute’s integrated services—can’t protect farmers from commodity price swings without broader systemic change. The pilots have proven that paying living income prices is commercially viable, that transparency builds trust, and that the frameworks work. But they’ve also proven something equally important: even the industry’s most progressive models can’t solve a $4.91 billion systemic problem when operating at a ~$60 million annual scale (€7M Tony’s + ~$53M Nestlé combined). The gap is too large. The number of farmers too many. The commodity price volatility too extreme.
The Integration Imperative: Why Holistic Solutions Matter
These pilots reveal a clear pattern: cash transfers alone are necessary but insufficient. Progress fades without complementary support.
The successful formula emerging from these pilots:
Cash for immediate relief (closing current income gaps) — All programs showed cash drives resilience and enables investments
GALS for gender equity (transforming household power dynamics) — ICI study proved women’s empowerment requires intentional targeting
VSLAs for financial resilience (building savings and social capital) — Critical infrastructure across all successful interventions
Productivity support (increasing cocoa income sustainably) — 18% yield gains in Nestlé program, but reinforced cocoa dependency
Income diversification (reducing cocoa dependency) — The missing piece: no program achieved this despite efforts
Digital payment infrastructure (ensuring cash actually reaches farmers) — Implementation challenge that cut Nestlé’s impact by 64%
The scale challenge remains: These pilots collectively reached ~60,000 households—less than 5% of Côte d’Ivoire’s 1.2 million cocoa farming households below living income. The programs demonstrate what works at pilot scale, but the gap between proven interventions and national transformation is a chasm that premium programs and conditional cash cannot bridge alone.
Recall the typical cocoa farming household introduced earlier: even with generous premiums (Fairtrade + Living Income of $736/ton), farmers producing 1.16 tons annually earn just $2,803—leaving a $4,047 gap to the $6,850 living income benchmark. The premiums help, but they close less than a third of the total deficit.
This is a volume problem, not just a price problem. Farmers produce 1-2 tons per year. Even doubling the premium per ton still leaves them far short of living income.
The fragmentation challenge:
Tony’s Open Chain: 20 Mission Allies, ~30,000 farmers reached
Total certified farmers across all schemes: ~50,000-100,000
Coverage: 3-7% of Côte d’Ivoire’s 1.5 million farmers
The other 93-97%: No path to living income
Each company pays premiums only for beans they purchase, only to farmers in their certified supply chains. This creates:
Coverage gaps: Vast majority of farmers outside certified systems
Inefficiency: 20+ different premium programs, each with administrative overhead
Competition for certified farmers: Multiple buyers competing for same limited pool
Restrictive incentives: Farmers must sell to specific buyer to get premium, reducing market flexibility
Unpredictability: Premiums vary by buyer, season, volume delivered
No leverage: Only private sector money, no multiplication effect
Result: Lots of pilot projects, zero systemic impact. The 95% of farmers outside certified supply chains have no mechanism for improvement.
Certification schemes show similar limitations:
The broader sustainability certification landscape tells the same story:
RSPO (palm oil): Associated with reduced deforestation, but primarily on plantations where remaining forest areas were already small, yielding minimal net avoided deforestation compared to total sector deforestation.19
Rainforest Alliance/UTZ (cocoa): Studies show “mixed and modest” impacts on productivity and incomes. Good Agricultural Practices can enhance outcomes, but only if structural barriers (return-on-investment uncertainty, access to finance) are addressed.20
The pattern is clear: voluntary, fragmented approaches reach 5-10% of producers and generate modest improvements within that subset. They cannot and will not achieve systemic transformation.
PART 2: A New Framework - Quantifying Shared Responsibility Across Supply Chains
The current system externalizes costs. Farmers bear the burden of poverty, children work instead of attending school, forests disappear. Meanwhile, chocolate companies and consumers enjoy products priced as if these costs don’t exist.
In this section, this framework will show how private sector shared responsibility contributions can cover $2.86 billion annually (58.26% of the $4.91 billion total income gap). The remaining 41.74% will be addressed through public financing mechanisms in Part 3.
What if one could quantify how much buyers benefit from this arrangement? And what if that calculation could determine fair contributions to fixing the system?
Recent research on palm oil supply chains offers exactly this: a method for estimating shared responsibility based on who benefits most from externalizing social and environmental costs.
Palm Oil Research: A Quantifiable Framework for Shared Responsibility
Overview of the research approach:
In a 2025 paper published in the Journal of Cleaner Production, researchers from Copenhagen Business School, Lafayette College, and the University of London developed “A method for estimating buyers’ shared responsibility for oil palm expansion.”21
The framework has three key components:
Estimate ecosystem service losses: Calculate the value of greenhouse gas emissions from deforestation for oil palm expansion using carbon pricing
Attribute costs spatially: Link emissions to specific production regions/concessions meaningful for buyer sourcing decisions
Allocate responsibility between value-chain actors: Use market surplus analysis to determine fair burden-sharing between buyers and sellers
How buyer surplus calculations allocate responsibility:
The breakthrough insight: When environmental costs aren’t internalized, both buyers and sellers benefit economically from the transaction. The question is: who benefits more?
To answer this, the researchers analyzed actual transaction data from the RSPO Credits marketplace (PalmTrace):
6,220 observations from 2017-2022
3,180 bids, 3,040 offers, 361 completed transactions
Bid prices reveal what buyers were willing to pay
Offer prices reveal what sellers were willing to accept
Actual prices show where transactions cleared
Using standard economic surplus analysis, they calculated:
Buyer surplus: Difference between what buyers would have paid and what they actually paid
Seller surplus: Difference between what sellers received and minimum they would have accepted
The shared responsibility coefficient (β):
β = (Total buyer surplus) / (Total buyer surplus + Total seller surplus)
Result: β_palmoil = 0.4303 (43% buyer responsibility, 57% seller responsibility)
This coefficient represents the fair allocation based on who captures more economic value from a system where environmental costs are externalized.
Indonesia palm oil example with numbers:
The researchers applied this framework to recently available Trase Indonesia Supply Chain data estimating gross emissions from land conversion to industrial oil palm (2001-2022).22
Using a carbon price of $24.18/ton CO2e (median global compliance market price, World Bank 2024):
Total buyer shared responsibility: $5.8 trillion cumulative (2001-2022)
Annual average: ~$264 billion/year
As percentage of palm oil production value (2018-2022): ~3%
Key insight: Even with conservative carbon pricing and restrictive definitions (only direct emissions from concessions, only aboveground biomass in the simplified examples), the values are substantial, representing approximately 3% of palm oil production value across Indonesia.
The framework demonstrates that shared responsibility can be quantified, attributed, and allocated fairly using real market data and established economic principles.
Translating the Framework to Cocoa - With a Critical Difference
Adapting the methodology but redirecting its purpose:
The palm oil research calculated responsibility for historical emissions: past environmental damage from deforestation. While scientifically robust, this creates a backward-looking liability framework: “You caused this damage, you owe compensation.”
This proposal takes a fundamentally different approach: It adapts the calculation methodology but applies it to ongoing crises and future solutions, not historical blame.
Here’s why this matters:
Palm oil framework (backward-looking):
Calculates emissions from past land conversion (2001-2022)
Assigns responsibility for historical damages
Creates defensive posture: “You’re blaming us for history”
Companies resist: liability, legal exposure, historical culpability debates
Our cocoa framework (forward-looking):
Calculates current living income gap affecting 1.2M households now
Calculates ongoing forest loss happening today
Assigns responsibility for future solutions
Creates collaborative posture: “Let’s fix this together going forward”
Companies align: investment in viable future, not penance for past
This isn’t semantic; it’s strategic. I believe focusing shared responsibility on protection, restoration, and living wages is more effective than historical compensation. Value chain actors may be more motivated to correct current social injustices and ongoing illegal/unethical labor practices while simultaneously regenerating forests than to pay for historical damages they’ll endlessly contest.
Zero allocation to “compensation for historical damages.”
This is not a liability fund. It’s an investment fund in a viable cocoa sector.
The adapted framework:
The framework keeps the rigorous calculation method but changes what is measured:
Palm oil: Emissions from deforestation (environmental externality)
Cocoa: Living income gap (social externality)
Common principle: Both are costs externalized by the market that buyers and sellers should share responsibility for addressing
Three allocation factors for cocoa buyers:
Share of cocoa sourced from high-risk origins
What percentage of Côte d’Ivoire production does each buyer source?
This determines proportional exposure to the living income gap
Historical reliance on pricing below living income
How long has the buyer been sourcing from these origins?
Not to assign blame, but to recognize cumulative benefit from the current system
Growth trajectories in demand
Is the buyer increasing or decreasing sourcing volumes?
Future responsibility scales with future demand
Creating Buyer-Specific “Living Income Responsibility Shares” and why this changes everything
The shared responsibility framework requires three calculation steps, but only the third step represents a true departure from current practice. Understanding this distinction is critical.
STEP 1: Determine buyer’s sourcing footprint (Similar to current practice)
Example: Major Chocolate Company A
Annual sourcing from Côte d’Ivoire: 100,000 tons
Côte d’Ivoire total production: ~2.2 million tons/year
Buyer’s market share: 4.5%
This is basic accounting. Tony’s Open Chain and others already track this.
STEP 2: Apply shared responsibility coefficient (β) (Cocoa-specific calculation)
Developing a commodity-specific coefficient from actual market data:
Rather than relying on a palm oil proxy, we calculate β directly from Côte d’Ivoire’s cocoa market structure using the 2023/24 main season forward contract system.
The calculation methodology:
Following Jakob et al. (2021) and Pasaribu et al. (2025), buyer responsibility reflects the economic surplus captured when externalities (living income gaps) are not priced in:
β = Buyer Surplus / (Buyer Surplus + Seller Surplus)
Using 2023/24 forward contract data:
Forward contract price (Sept/Oct 2023): $4,000/ton (CIF, upper limit)
Locked farmgate price: $2,400/ton (60% of forward, locked for 6-month main season)
Actual market price (median, Oct 2023-Mar 2024): $5,750/ton
Calculation:
Buyers paid farmers: $2,400/ton (locked farmgate)
Buyers sold at market: $5,750/ton (median during main season)
Buyer surplus: $5,750 - $2,400 = $3,350/ton
Seller surplus: $2,400/ton
β_cocoa = $3,350 / ($3,350 + $2,400) = 0.5826 (58.26%)
This empirically-derived coefficient replaces the palm oil proxy (0.4303) with cocoa-specific data reflecting the actual surplus distribution in Côte d’Ivoire’s forward contract system.
The long-term incentive alignment: This framework creates a powerful market dynamic—as farmgate prices rise (whether through improved contract terms or government pricing), the living income gap shrinks, which directly reduces buyers’ shared responsibility contributions. This aligns buyers’ economic interests with raising contract and farmgate prices over time, as every dollar increase in farmer income reduces their proportional obligation to the fund. Unlike premium systems where higher prices simply mean higher costs, shared responsibility converts price increases into reduced burden sharing.
Apply to example company:
Total country gap: $4.91 billion/year
Buyer’s market share: 4.5%
Buyer’s share of gap: 4.5% × $4.91B = $221M
Buyer’s responsibility (β=58.26% coefficient): $221M × 0.5826 = $128.7 million/year
This provides a fair, empirically-grounded allocation based on actual cocoa market dynamics.
Differentiating Value Chain Actors: Allocating Responsibility Where Power and Profit Reside
The 58.26% buyer responsibility coefficient provides a science-based foundation, but the cocoa value chain requires further differentiation. The term “buyer” obscures significant differences in market power, margin capture, and windfall benefits among value chain actors.
Applying surplus-based burden sharing (Jakob et al., 2021):
Following the methodology in Pasaribu et al. (2025), responsibility among buyer tiers should be allocated based on economic surplus captured—the value each actor gains from participating in a market where social costs (like living income gaps) are not internalized. The 2024/25 cocoa price surge provides empirical evidence of this surplus distribution.
The 2024/25 price spike analysis: When global cocoa prices quadrupled from $2,500 to $12,000 per ton, the $9,500/ton windfall was captured as follows:
Exporters/Traders: $6,500/ton surplus (68% of windfall)
Processors: $4,000/ton surplus (42% of windfall)
Manufacturers: $2,000/ton surplus (21% of windfall)
Farmers: $340/ton (+3.6%), while income actually declined 11% in real terms
(Note: Total exceeds 100% due to ownership overlap between processors and manufacturers)
Calculating delta (δ) coefficients:
Following the supply chain burden-sharing framework (Pasaribu et al., 2025, Equations 14-15), each tier’s share equals their surplus divided by total downstream surplus:
δ₁ (Exporters) = $6,500 / $12,500 = 52% δ₂ (Processors) = $4,000 / $12,500 = 32% δ₃ (Manufacturers) = $2,000 / $12,500 = 16%
This surplus-based allocation (52%/32%/16%) reveals that exporters, who captured the majority of windfall profits during price volatility, bear proportionally greater responsibility for addressing the living income gap that enabled those windfalls.
Three distinct actor categories within “buyers”:
1. Exporters/Traders (52% of private contribution = $1.49B/year):
These companies—Barry Callebaut, Cargill, Olam Food Ingredients, ECOM, Sucden, Touton, and 103 others—hold Côte d’Ivoire export licenses and control the forward contract system. During the 2024/25 price surge, they captured $6,500/ton (68% of windfall) by purchasing from cooperatives at locked farmgate prices while selling into spot markets. Their 52% allocation reflects this dominant surplus capture, control over export licenses and forward contracts, and ability to refuse purchases when government-set prices become “uncompetitive.”
2. Processors (32% of private contribution = $915M/year):
Processing operations that grind beans into cocoa butter, powder, and liquor captured $4,000/ton (42% of windfall) through expanding crushing margins during the price spike. This category applies only to processors operating separately from exporters (many major exporters own processing facilities and are allocated under the exporter tier to avoid double-counting). Their 32% allocation recognizes the substantial value they extract from the processing stage.
3. Manufacturers/Brand Companies (16% of private contribution = $458M/year):
Chocolate manufacturers—Mars, Mondelez, Nestlé, Hershey, Ferrero, Lindt, and others—captured $2,000/ton (21% of windfall) during the price spike, partially protected by forward contract hedging. While they captured a smaller windfall portion, they benefit from retail margins on products priced as if farmers earned living wages. Their 16% allocation recognizes brand responsibility and consumer-facing accountability while not over-burdening them relative to actual surplus capture.
Allocation methodology:
Each company’s contribution is calculated based on their market share of Côte d’Ivoire cocoa in their respective tier:
Example - Exporter Tier (52% of $2.86B = $1.49B):
Company with 500,000 tons (22.7% of 2.2M ton CI production)
Contribution: $1.49B × 22.7% = $338M/year
Example - Processor Tier (32% of $2.86B = $915M):
Company processing 300,000 tons CI cocoa (13.6% market share)
Contribution: $915M × 13.6% = $124M/year
Example - Manufacturer Tier (16% of $2.86B = $458M):
Company sourcing 200,000 tons CI cocoa (9.1% market share)
Contribution: $458M × 9.1% = $42M/year
This differentiation ensures responsibility aligns with market power and empirically-measured benefit capture, preventing exporters from hiding behind brand visibility while placing proportional expectations on each value chain segment based on actual surplus distribution observed during price volatility.
The key insight: Exporters who captured $6,500/ton in windfall profits during the 2024/25 price spike while farmers’ incomes fell are allocated $1.49B annually ($677/ton on 2.2M tons)—just 10.4% of their windfall. This isn’t punitive; it’s proportional to the structural advantages they hold in the current system, calculated using the same surplus-based methodology developed for palm oil supply chain responsibility allocation (Pasaribu et al., 2025).
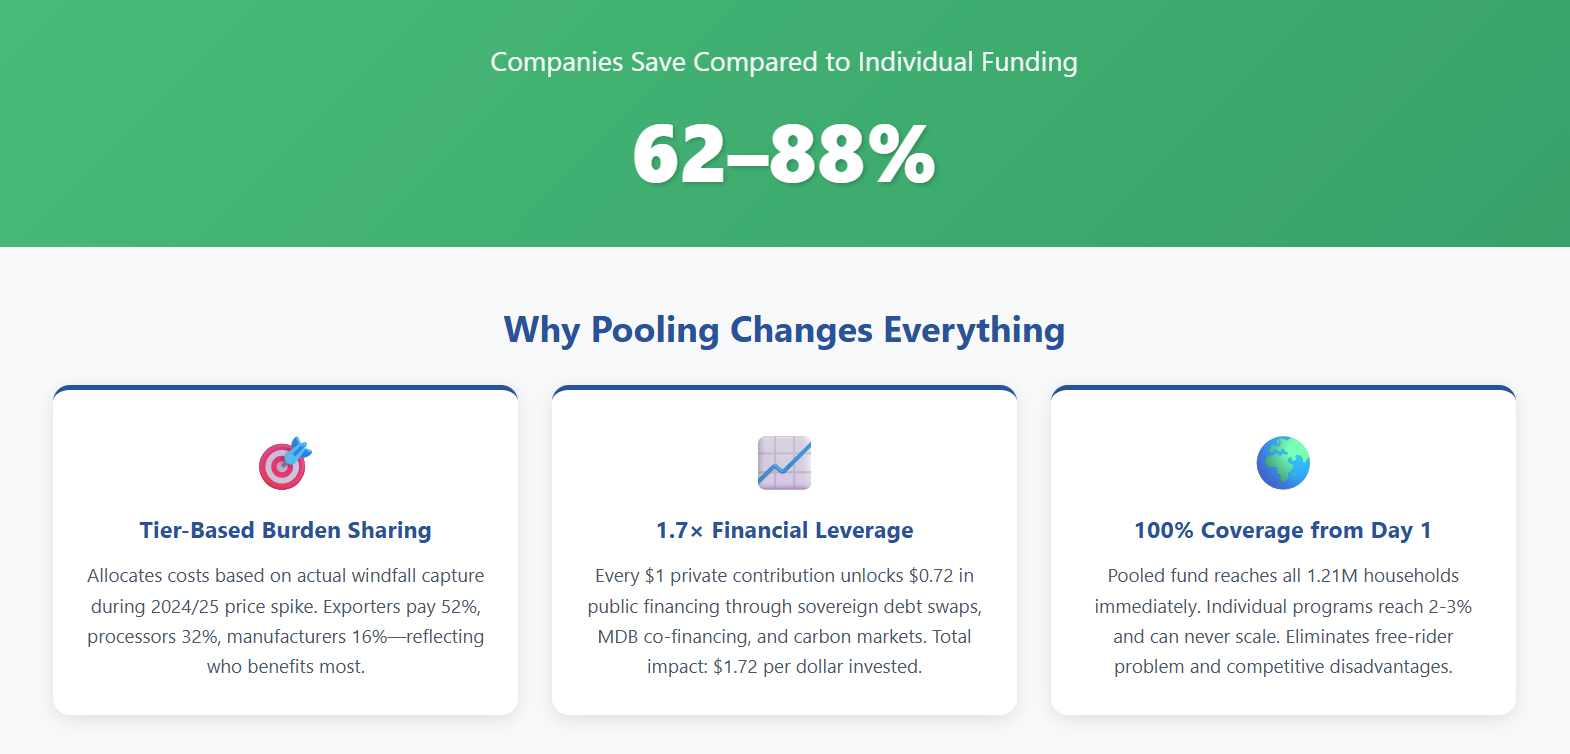
When calculating shared responsibility payments and comparing them to what companies would need to spend to close the living income gap, a striking pattern emerges: pooling and leverage transforms economics.
Companies would save 62-88% compared to funding their proportional share of the living income gap individually. Why? Because the shared responsibility framework combines tier-based burden sharing (allocating costs based on actual windfall capture) with 1.7x financial leverage from sovereign debt swaps, carbon finance, and MDB co-financing—making individual funding far less efficient by comparison.
Company-by-Company Impact:
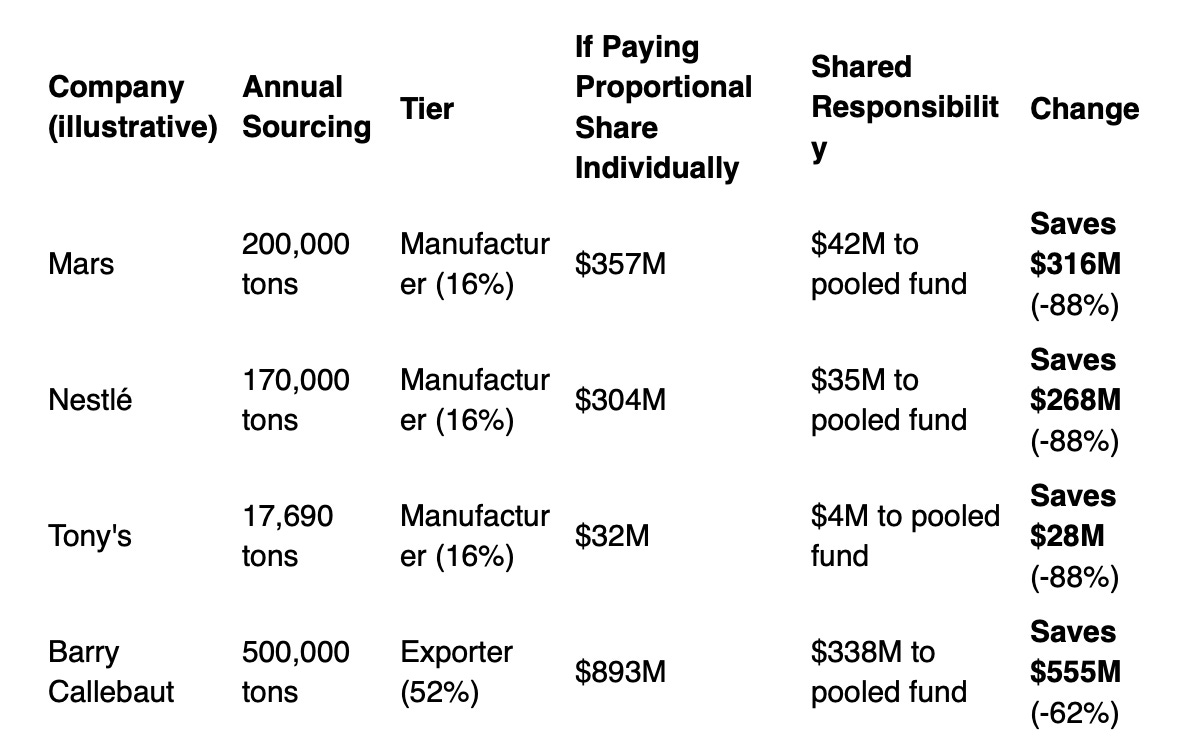
Note: Proportional share calculated as market share × $3.93B total living income gap ($1,786/ton to close full gap). Without pooling, companies would pay this individually with no leverage from debt swaps, carbon finance, or MDB co-financing. Shared responsibility based on tier allocation (manufacturers 16% of $2.86B = $458M total; exporters 52% of $2.86B = $1.49B total; processors 32% of $2.86B = $915M total) multiplied by market share, with 1.7x multiplication from public financing.
STEP 3: PRE-COMPETITIVE POOLING INTO COUNTRY-LEVEL FUND ✨ (THIS is the TRANSFORMATION) ✨
This step is what fundamentally distinguishes shared responsibility from all existing premium models.
Current Model: Fragmented Company-by-Company Payments
How Tony’s Open Chain and other premium programs work today:
Company A buys 200,000 tons → Pays $147M in premiums → 15,000 farmers benefit
Company B buys 180,000 tons → Pays $132M in premiums → 13,000 farmers benefit
Company C buys 150,000 tons → Pays $110M in premiums → 11,000 farmers benefit
Total: $389M paid, 39,000 farmers helped
Remaining: 1,174,500 farmers still in poverty (97% of the problem unsolved)
The problems:
Coverage gaps: Only farmers in certified/contracted supply chains benefit
Inefficiency: Overlapping administrative systems, each company managing their own
Competition for certified farmers: Multiple buyers bidding up costs for limited pool
Restrictive incentives: Farmers must sell to specific buyer to get premium
Unpredictability: Premiums vary by buyer, season, volume
No leverage: Only private money, no multiplication effect
Fragmentation: 20 pilot projects, zero systemic impact
Key limitation: Each company optimizes for their own supply chain, not the system as a whole.
Shared Responsibility Model: Pooled Country-Level Fund
How the transformation works:
Step 1: Calculate each company’s responsibility by tier
Exporters (52%): $1,487M/year
Manufacturers (16%): $458M/year
Processors (32%): $915M/year
= Total private sector: $2,860M/year
Step 2: all funds flow into single Special Purpose Vehicle (SPV)
Step 3: SPV leverages private funds to unlock public financing
(An outline on how this leverage mechanism works in Part 3 below.)
Private sector: $2,860M/year
↓
Enables debt swap: $1,155M/year (debt relief + MDB co-financing + bilateral)
Enables carbon finance: $426M/year (forest credits monetized at realistic rates)
Enables government match: $466M/year (subsidy redirection)
↓
TOTAL FUND: $4,907M/year (1.7x multiplication effect)
Step 4: Country-level distribution to all farmers in poverty
Fund distributes to 1,213,500 households based on:
✓ Income gap severity (larger gaps receive more)
✓ Household vulnerability (female-headed, disabled members, etc.)
✓ Farm productivity potential (ability to benefit from support)
**not** based on:
✗ Which company they sell to
✗ Whether they’re in a certified program
✗ Whether they have a commercial contract
Result: 100% coverage of farmers below living income, not just 5%.
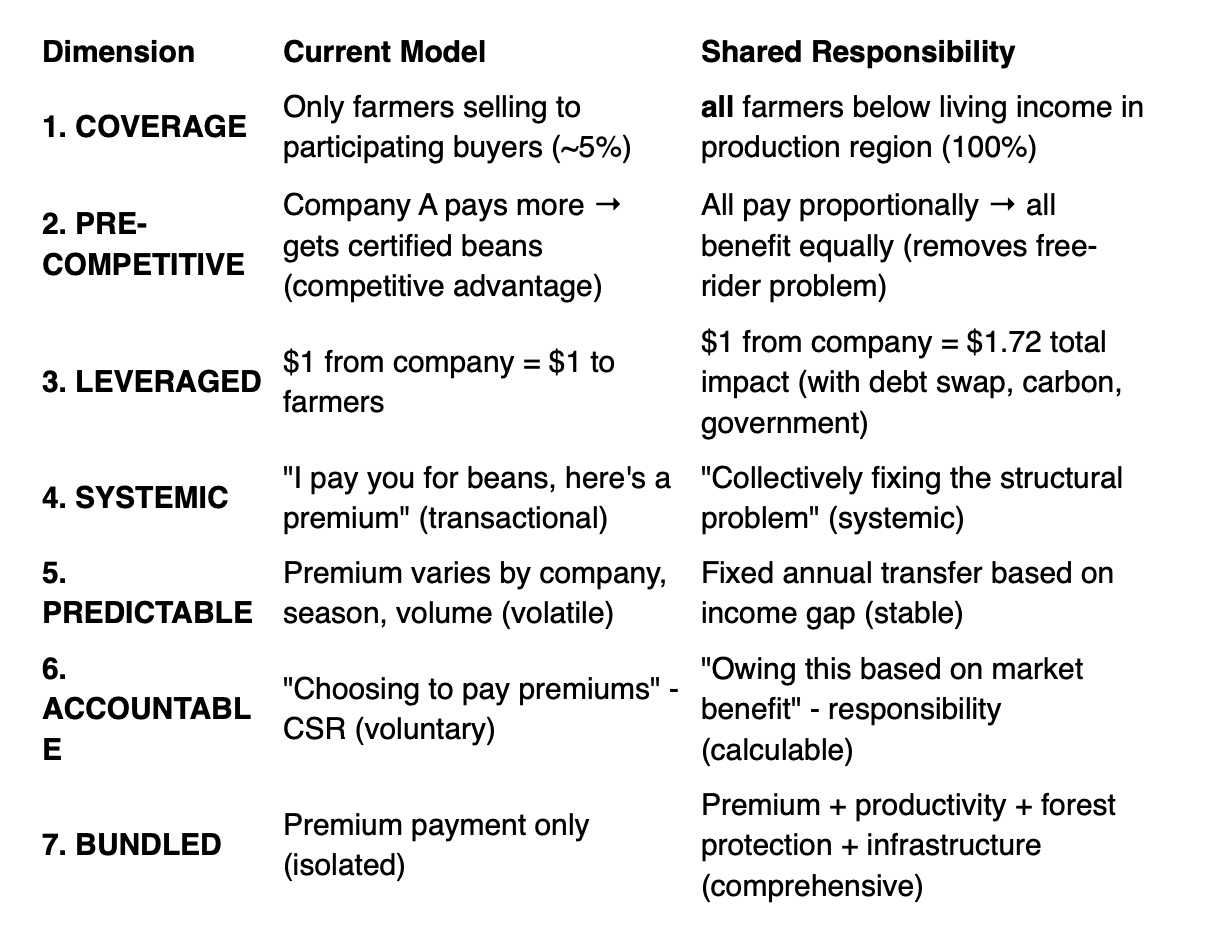
What Makes This Fundamentally Different: 7 Key Transformations
Key Takeaway from Part 2: The shared responsibility framework demonstrates how private sector contributions can provide $2.86 billion annually (58.26% of the total income gap) through fair, calculable allocations based on market share and windfall capture. Critically, these contributions flow into a pooled fund rather than fragmented company-by-company premium programs. But private sector funding alone won’t close the full $4.91 billion gap. The remaining 41.74% requires unlocking sovereign-scale public financing, which is exactly what Part 3 addresses.
Before diving into the financing mechanisms, it’s essential to understand the key difference between premium programs and the fund:
What they have in common: Neither premium programs (Tony’s, Nestlé, EnRoute) nor the fund attempt to disrupt the existing cocoa trade system. The CCC-regulated infrastructure—farmers selling to cooperatives at government-set farmgate prices, cooperatives delivering to licensed exporters, forward contracts, export licenses—continues operating exactly as it does today. Both approaches accept this reality and work within it.
The critical difference: delivery mechanism and scale
Premium programs deliver supplements through fragmented, company-specific channels:
Tony’s pays LIRP premiums through their partner cooperatives (32,133 farmers, 2.1% coverage)
Nestlé distributes conditional cash via individual Mobile Money accounts (30,000 farmers, 64% delivery gap due to expired accounts, lost SIM cards, verification failures)
EnRoute provides cash transfers to participating households (599 farmers in pilot)
Result: Multiple parallel systems, each reaching <5% of farmers, high delivery failure rates, no coordination
The fund creates a single, aggregated supplement delivery system through Village Savings and Loan Associations (VSLAs):
Proven model: CARE’s VSLA methodology reaches 30 million people globally across 15+ countries
Aggregated coverage: One system serving all 1,213,500 farmers below living income (100% coverage, not fragmented 2-5%)
Community-led distribution: Cash transferred to ~60,000 VSLA groups quarterly, distributed at regular meetings with facilitator verification
Eliminates delivery failures: No individual mobile money account dependencies, no expired accounts, no SIM card issues, no ID verification failures
Government partnership: Côte d’Ivoire government already collaborating with CARE on VSLA scale-up (established 2025)
Builds permanent capacity: By Year 10, VSLA infrastructure + demonstrated success creates conditions for mandatory LIRP and sustained productivity gains
The key innovation isn’t changing what premium programs do—it’s aggregating and scaling what works: Both premium programs and the fund leave cocoa trade unchanged. Both provide supplements outside the trade system. The difference is the fund consolidates fragmented efforts into a single VSLA-based delivery mechanism that reaches 100% of farmers from Year 1, rather than 2-5% through disconnected company programs.
PART 3: The Multiplier Effect - Sovereign Debt-for-Nature & Income Swaps
Progressive companies paying living income prices can’t close a $4.91 billion annual gap alone. Even if all top 20 buyers joined, they’d contribute $2.9B/year, which represents 58% of what’s needed.
The breakthrough: Leverage private sector contributions to unlock sovereign-scale public financing.
The fund design allocates:
80% → Living income support (ending current poverty)
10% → Productivity & climate resilience (preventing future crises)
7% → Forest protection & restoration (stopping ongoing loss, regenerating degraded land)
3% → Administration & M&E
This is where debt-for-nature swaps enter, but with a critical innovation.
The Financing Gap and Opportunity
Côte d’Ivoire sovereign debt context:
Total external debt: ~$30 billion (2023)
Annual debt service: ~$2-3 billion/year
Cocoa export revenues: ~$6-8 billion/year (critical for foreign exchange)
IMF program constraints limit fiscal spending
The constraint: Government wants to support farmers (political imperative) but cannot afford $4.91B/year in direct transfers. Debt burden prevents borrowing for this purpose.
Result: Structural inability to address the problem domestically, despite political will.
When $1 Becomes $1.72: The Sovereign Financing Advantage
How debt-for-nature swaps work:
Traditional mechanics:
Country has external debt to creditors
Conservation organization buys debt at discount
Debt is forgiven/restructured
Country commits equivalent local currency to conservation
Result: Creditor gets partial repayment, country gets debt relief, conservation gets funding
Successful precedents:
Belize (2021): $364M debt → $553M conservation over 20 years (30% of ocean protected)
Ecuador (2023): $1.6B debt swap → $450M Galápagos conservation over 18 years
Gabon (2023): $500M debt → $163M ocean conservation (26% of waters protected)
Proposed innovation: Debt-for-Nature-and-Income Swaps
Combine forest protection with living income support, addressing both the environmental and social externalities in cocoa production.
Learning from Past Failures: A More Honest Approach
Before diving into the mechanics, I need to be transparent about what debt swaps can and cannot accomplish.
The scalar mismatch problem: Traditional debt-for-nature swaps have suffered from a fundamental limitation. They generate meaningful conservation funding but barely dent the underlying debt burden. Ecuador’s celebrated $1.6B Galápagos swap, for instance, provided $450M for conservation over 18 years but represented only 1.6% of the country’s total external debt. Colombia rejected similar proposals entirely due to concerns about credit rating impacts.
What this means for Côte d’Ivoire:
Total external debt: ~$30 billion
This proposal’s debt component: $7.7B restructured (26% of total debt)
In practice, this would be structured in multiple tranches over several years, not a single transaction
Annual debt service relief: $461M/year23
Reality check: This is substantial but not a complete solution to Côte d’Ivoire’s debt burden
Why this matters: I’m not proposing debt swaps as a silver bullet for sovereign debt crises. The $461M/year in debt service relief (based on realistic blue bond interest rates matching proven precedents) is meaningful, but Côte d’Ivoire will still face significant debt obligations. This is why the fund design integrates multiple financing mechanisms (private sector contributions, carbon markets, MDB co-financing, bilateral aid) rather than relying on debt relief alone.
The honest framing: This proposal uses debt restructuring as one lever among many to unlock resources for living income and forest protection. It’s a financing innovation, not debt reform. Countries facing debt crises need comprehensive reform of international financial architecture (expanded SDRs, reformed debt sustainability frameworks, fairer lending terms), and this mechanism should be seen as complementary to, not a substitute for, those broader reforms.
Governance That Actually Works
Past debt swaps need improvement with sovereignty and accountability. Ecuador’s Galápagos swap created a foundation with limited oversight by the Ecuadorian government. Local organizations filed formal complaints alleging:
Lack of transparency in fund allocation
Minimal community governance
No meaningful consultation with affected populations
Questionable evidence of conservation outcomes
This cannot be the model.
Proposed Governance Structure: Ivorian-Led Fund Management
The Living Income and Forest Protection Fund would be established as an Ivorian legal entity with a 15-member governance board: 40% farmer cooperatives (with mandatory women’s representation), 27% government ministries, 20% civil society, and 13% independent technical experts.
This structure ensures local control, prevents donor capture, and maintains accountability to affected communities.
Why Côte d’Ivoire Works for This Model
Why Côte d’Ivoire is the perfect candidate:
High debt burden with significant cocoa revenues
Deforestation crisis (lost 90% of forest cover)
Living income crisis affecting 1.5M households
Climate vulnerability threatening future cocoa
Political will to address farmer poverty
EXAMPLE PUBLIC-PRIVATE FUND STRUCTURE
Total Fund Size: $49.1 billion over 10 years ($4.91B/year)
This fund closes 100% of the living income gap for all 1,213,500 cocoa farming households, bringing every farmer to the $6,850 living income benchmark. While a simple average suggests a $4,047 gap per household, farmers actually sit on an income distribution curve—some very close to the benchmark (small gaps), others in deep poverty (large gaps). Using a distribution-weighted approach based on actual farmer income data, 80% of the fund ($3.93B) closes all income gaps, while the remaining 20% invests in productivity, forest protection, and administration to sustain these gains.
The multiplication effect:
$7.7B debt restructured (with realistic blue bond rates) frees $461M/year in debt service
This leverages $496M MDB co-financing + $198M bilateral donors
Result: Every $1 of debt relief generates $2.51 in total public financing
Note on carbon allocation: The 58.26% private sector contribution earns proportional carbon insets (116.5M tons CO2e over 10 years) that companies can claim toward Scope 3 targets. The remaining 41.74% (83.5M tons) is monetized at $51.04/ton to generate $426M/year in revenue. This carbon price (maintained from previous calculation) compensates for the realistic debt restructuring terms based on successful blue bond precedents (Ecuador’s 5.645% rate, not 0%). This structure aligns incentives: private sector gets verified supply chain emission reductions, while public financing is calibrated to maintain the $4.91B annual fund target.
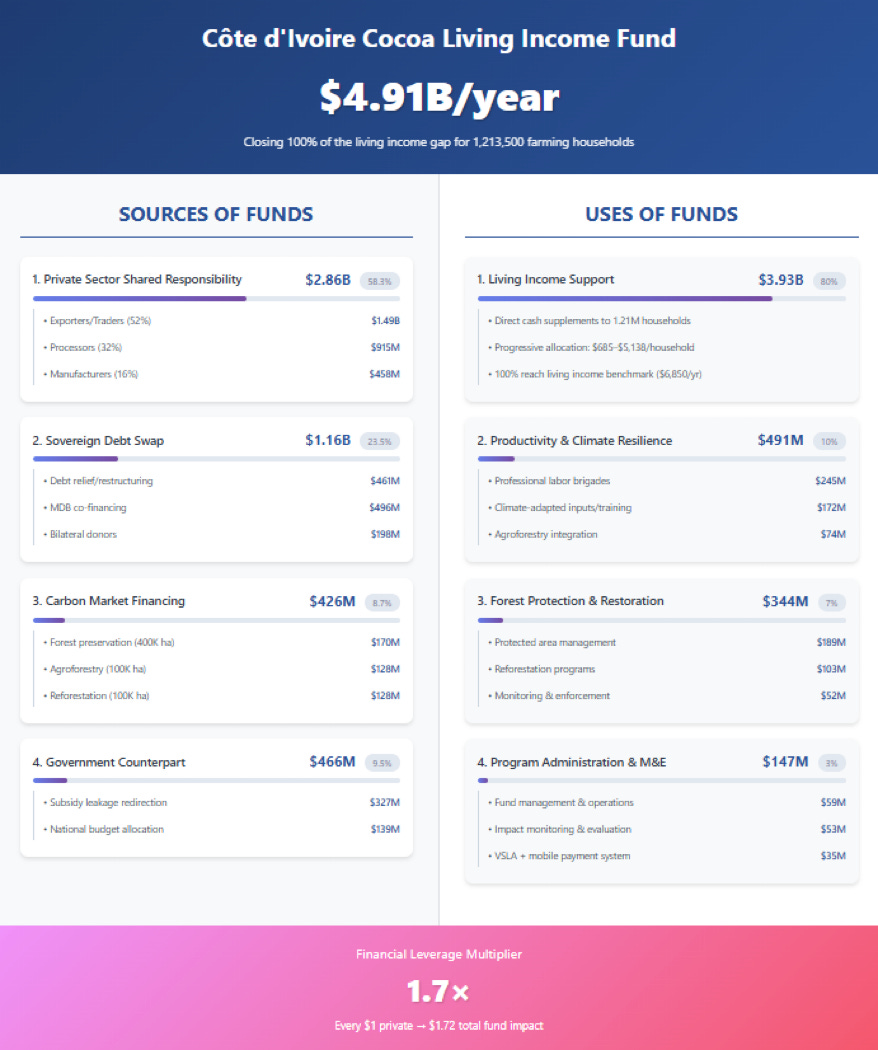
SOURCES of FUNDS ($4.91B/year)
1. Private Sector Shared Responsibility: $2.86B/year (58.3%) - as described earlier in Part 2
Tier-based allocation (surplus-based burden sharing):
Exporters/Traders (52% of private contribution): $1,487M/year
Processors (32% of private contribution): $915M/year
Manufacturers/Brands (16% of private contribution): $458M/year
Note: Tier percentages (52%/32%/16%) calculated using delta (δ) coefficients from actual surplus distribution during 2024/25 cocoa price spike, following Jakob et al. (2021) shared responsibility methodology as applied in Pasaribu et al. (2025). The 58.26% buyer responsibility coefficient is calculated from 2023/24 main season forward contract data: buyers captured $3,350/ton surplus by locking farmgate prices at $2,400/ton while median market price was $5,750/ton.
2. Sovereign Debt Swap: $1.16B/year (23.5%)
Debt relief/restructuring: $461M/year
Bilateral creditors (Paris Club): $110M/year (50% forgiveness + 2.5% rate)
Commercial creditors (Blue Bond): $135M/year (55% buyback + 5.5% rate)
Multilateral debt relief: $68M/year (3.5% IBRD rate)
Grace periods/extended maturities: $148M/year
MDB co-financing: $496M/year24
World Bank (IDA): $248M/year
African Development Bank: $174M/year
IFAD: $74M/year
Bilateral donor contributions: $198M/year25
EU development funds: $109M/year
UK FCDO: $50M/year
Other bilateral (France, Germany, Netherlands): $39M/year
3. Carbon Market Financing: $426M/year (8.7%)
Total carbon impact: 200M tons CO2e over 10 years (20M tons/year)
Carbon allocation split:
116.5M tons → Private sector insets (58.26% of carbon, matches funding proportion)
Goes to contributing companies as Scope 3 credits at $0 revenue
Proportionally allocated based on contribution
83.5M tons → Monetized (41.74% of carbon)
Sold at $51.04/ton (adjusted rate to compensate for realistic debt restructuring terms)
Generates $426M/year in revenue to fund
Breakdown by source:
Forest preservation credits: $170M/year
80M tons CO2e avoided over 10 years (8M/year)
400,000 hectares protected
4.66M tons/year → insets to private sector @ $0
3.34M tons/year → monetized @ $51.04/ton = $170M
Agroforestry carbon credits: $128M/year
60M tons CO2e sequestered over 10 years (6M/year)
100,000 hectares
3.50M tons/year → insets to private sector @ $0
2.50M tons/year → monetized @ $51.04/ton = $128M
Reforestation carbon credits: $128M/year
60M tons CO2e sequestered over 10 years (6M/year)
100,000 hectares restored
3.50M tons/year → insets to private sector @ $0
2.50M tons/year → monetized @ $51.04/ton = $128M
4. Government Counterpart Funding: $466M/year (9.5%)
Subsidy leakage redirection: $327M/year
Current subsidies captured by middlemen
Digital payments reduce leakage, redirect to farmers
National budget allocation: $139M/year
Agricultural development reallocation
Demonstrates government co-investment
USES of FUNDS ($4.91B/year)
1. Living Income Support: $3.93B/year (80%)
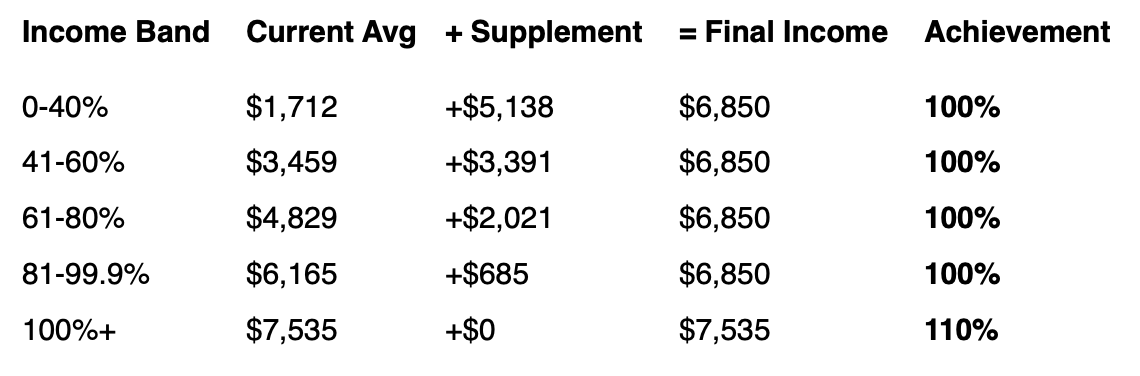
The $3.93B living income support allocation closes 100% of income gaps for all 1,213,500 households, bringing every farmer to the $6,850 living income benchmark. Rather than assuming uniform gaps, the fund uses a progressive, distribution-weighted allocation based on where farmers actually sit on the income spectrum.
Result: Progressive targeting ensures the poorest third of farmers (0-40% band) receive the largest supplements ($5,138/year), while those already near the threshold receive smaller top-ups. All 1,213,500 households reach 100% of the $6,850 living income.
Delivery mechanism (incorporating lessons from Nestlé Income Accelerator):
Digital payments via mobile money with critical improvements to address the 64% delivery gap found in Nestlé’s program:
Proactive Mobile Money account registration and maintenance support
Regular account activity monitoring to prevent expiration
SIM card replacement assistance and mobile phone access programs
Enhanced network coverage in remote farming areas
Name verification systems ensuring cooperative records match Mobile Money accounts
Gender-sensitive cash distribution (ICI study findings):
Split payments to both household heads (male and female)
Women receive income diversification and VSLA-related transfers directly
Men receive farm productivity and agroforestry-related transfers
Ensures both farm investments and women’s empowerment outcomes
Annual household income assessment determines supplement amount based on actual income band
Quarterly disbursements aligned with agricultural calendar (pre-planting, mid-season, harvest, post-harvest)
Real-time verification through cooperative management systems and independent spot-checks
Components:
Base living income supplements: $3.34B/year
Progressive allocation by income band
Closes 100% of gap for each household
Split payments to male and female household heads
IMPACT: All farmers reach $6,850 benchmark
Emergency productivity boosters: $393M/year
Crisis payments during climate shocks
Prevents debt accumulation, child labor
IMPACT: Eliminates desperation measures
Seasonal cash payments: $196M/year
Covers lean months July-September
Targeted to food-insecure households (45% lower food insecurity found in Nestlé program)
IMPACT: Reduces hunger months from 4 to <1/year
2. Productivity & Climate Resilience: $491M/year (10%)
Professional labor brigades: $245M/year
Youth-led cooperatives, subsidized 50%
Addresses labor constraints without relying on child labor
Focused on highest-impact farms
IMPACT: Yields 580→800+ kg/ha over 7 years (Nestlé showed 18% yield gains)
Climate-adapted inputs/training: $172M/year
Drought-resistant varieties, pest management
GALS (Gender Action Learning System) training integrated into all farmer training
Couples-based training to improve joint decision-making
Targeted to most vulnerable regions
IMPACT: Reduce climate losses by 60%
Agroforestry integration: $74M/year
Pilot program: 100,000 hectares
Focus on demonstration sites
Addresses income diversification challenge (Nestlé showed no gains here)
IMPACT: +30% non-cocoa income in participating areas
3. Forest Protection & Restoration: $344M/year (7%)
Protected area management: $189M/year
Target: 400,000 hectares protected (12.4% of remaining forest)
Strengthened enforcement, community rangers
IMPACT: Halt cocoa expansion into protected areas
Reforestation programs: $103M/year
Target: 100,000 hectares restored (3.1% of current forest)
Native species, priority corridors
IMPACT: Connect fragmented forest patches
Monitoring & enforcement: $52M/year
Satellite monitoring, GPS traceability
IMPACT: Zero-tolerance deforestation enforcement
4. Program Administration & M&E: $147M/year (3%)
Fund management & operations: $59M/year
SPV governance, financial management, legal compliance
Lean structure with Ivorian staff
Impact monitoring & evaluation: $53M/year
Independent household surveys (annual)
Satellite forest monitoring
Third-party impact assessment
Gender-disaggregated data collection
Payment delivery system (hybrid approach): $35M/year
VSLA-based cash distribution (primary channel): Leverages existing community infrastructure
Cash transferred to VSLA groups quarterly, distributed during regular meetings
Builds on CARE’s 30-year proven model reaching 30M people globally
Côte d’Ivoire government already partnering with CARE on VSLA scale-up (2025)
Eliminates individual Mobile Money account failures (Nestlé’s 64% delivery gap)
Community-level accountability and verification
Coverage: 80% of households via ~60,000 VSLAs (20 farmers per group average)
Direct mobile money (supplementary): For households not in VSLAs
Partnership with existing platforms (Ensibuuko model proven in Uganda)
Tech platform + lender + credit scorer (CARE’s formula that works)
Focused support for account registration and maintenance
Coverage: 20% of households (~243,000 farmers)
Community facilitators: Trained through cooperative structures
Support VSLA operations and payment reconciliation
Monitor attendance and verify conditions for seasonal/emergency payments
Build on ICI’s CLMRS community facilitator model (already present in cooperatives)
VSLA ecosystem support (integrated across all components): Embedded in delivery system
VSLA establishment in all cocoa-growing communities (scaling CARE’s proven model)
Financial literacy and GALS training through VSLAs
Digital tools for record-keeping (tablet-based, community-controlled)
Connection to formal finance for members wanting larger loans
Evidence: Nestlé showed 63% higher VSLA membership, 105% higher savings; CARE has reached 30M globally
Impact: Women’s financial independence, household resilience, reduced leakage
Note on efficiency: At 3% administration costs, this fund would outperform most development programs (typically 5-8%). The VSLA-based delivery system reduces overhead by eliminating individual account management challenges, leveraging existing community structures, and consolidating support for 1.2M households under one mechanism. CARE’s government partnerships in Côte d’Ivoire (established 2025) provide proven pathways to scale.
Note on prioritization: The 80% allocation to direct living income support reflects a strategic choice to maximize immediate poverty reduction while maintaining essential productivity and forest protection programs. The reduced but focused 10% productivity investment targets highest-impact interventions, and the 7% forest allocation concentrates on core protected areas and critical corridors.
PROJECTED IMPACT
Household Income Transformation:
Using the distribution-weighted approach, all 1,213,500 households reach the $6,850 living income benchmark:
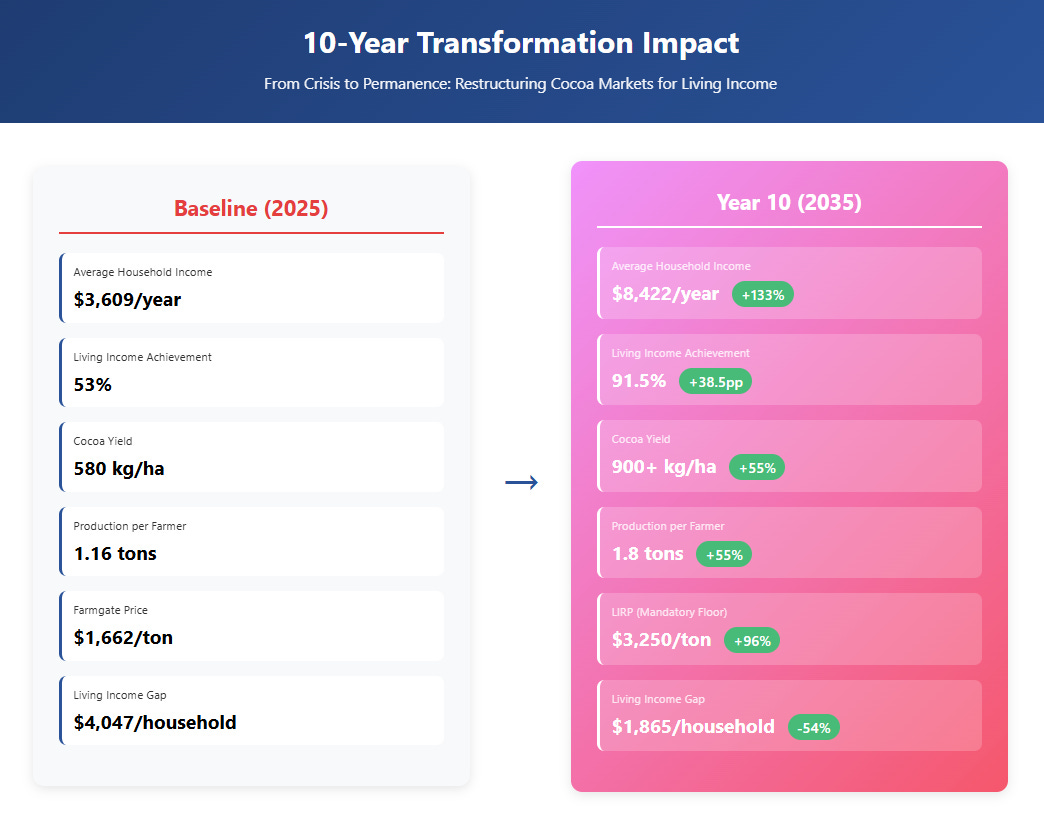
Weighted average transformation:
Current average: $3,609/year (53% of benchmark)
Weighted average supplement: +$3,241/year
Final average income: $6,850/year
Achievement: 100% of living income benchmark for all farmers
Why this works:
Progressive targeting: Poorest 32.9% receive largest supplements ($5,138)
Efficient allocation: 80% of fund ($3.93B) closes 100% of all gaps
Sustainable gains: Remaining 20% funds productivity/forest/admin
Evidence-based: Distribution reflects actual farmer income patterns from Tony’s, Fairtrade, and WUR studies
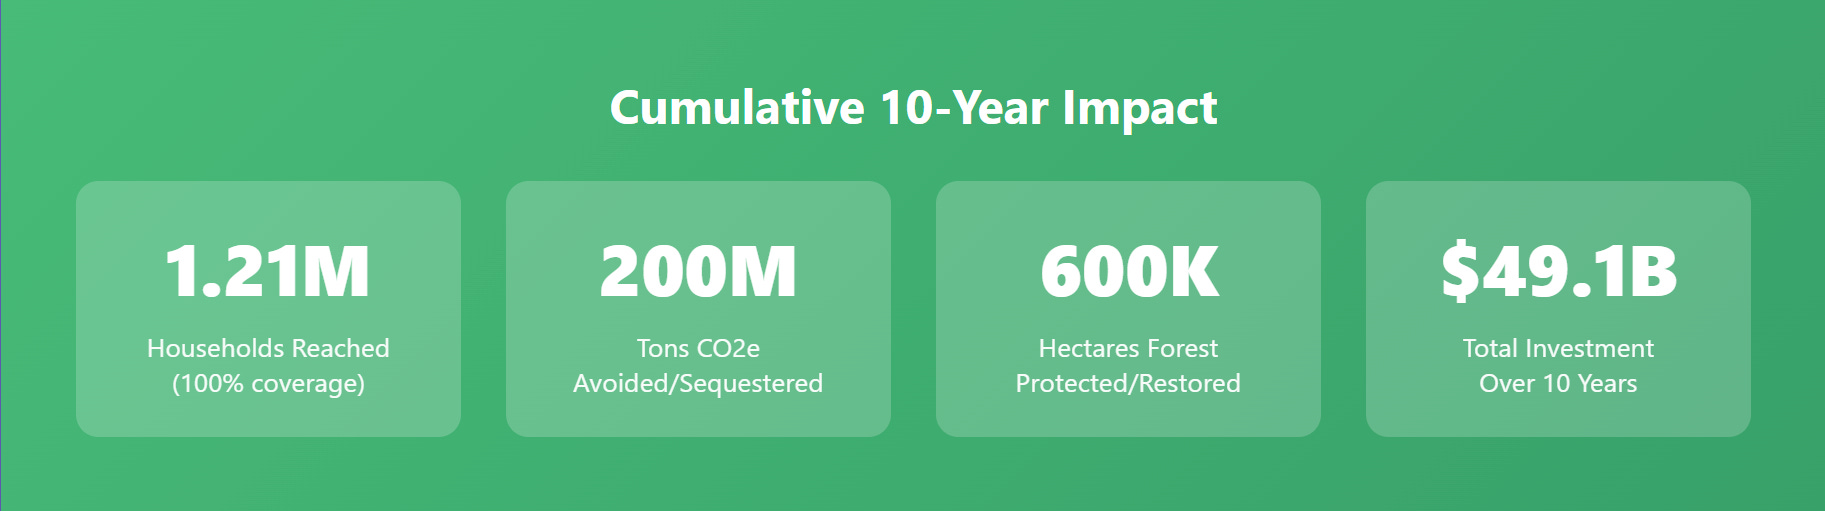
Combined Outcomes:
1,213,500 households reach full living income (100% of target population)
400,000 ha forest protected + 100,000 ha agroforestry + 100,000 ha restored = 600,000 total hectares
200M tons CO2e avoided/sequestered over 10 years
Child labor reduced 80%+ (as households exit poverty)
School enrollment 95%+ for children 6-14
Household food security improved by 65%
Women’s economic participation increased by 40%
Sustainability Beyond Year 10: The Evergreen Mechanism
The 10-year fund is designed to catalyze transformation, not create dependency. Without permanent mechanisms, farmers would face an income cliff when supplements end. The solution requires structural changes that preserve 100% living income achievement even as the benchmark rises with inflation.
The inflation challenge: The living income benchmark ($6,850 in 2025) will increase approximately 3% annually with inflation, reaching ~$9,200/year by 2035. Meanwhile, productivity gains and permanent price reforms must keep pace to maintain 100% achievement for all farmers
.
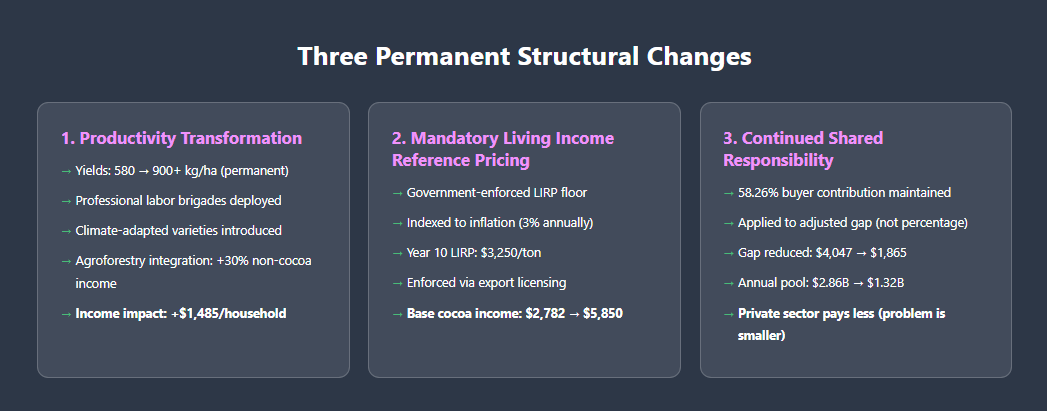
Three permanent structural changes:
1. Productivity transformation (Years 1-10, sustained beyond):
Yields increase from 580 kg/ha → 900+ kg/ha through sustained investment in:
Professional labor brigades (addressing labor constraints)
Climate-adapted varieties and pest management
Agroforestry integration (+30% non-cocoa income)
Result at Year 10: Average farmer producing 1.8 tons (vs. 1.16 tons baseline)
Income impact: +$1,485/household from increased cocoa production alone
Sustainability: Improved soil health, shade trees, and GAP adoption maintain higher yields permanently
2. Living Income Reference Price becomes mandatory minimum:
Côte d’Ivoire government implements mandatory LIRP floor (indexed to inflation)
Year 10 LIRP: $3,250/ton (vs. $2,398 baseline, accounting for 3% annual increase)
Enforced through export licensing and futures market regulation
Private sector already paying LIRP (Tony’s, others) demonstrates commercial viability
Result: Base cocoa income rises from $2,782 (baseline) → $5,850 (Year 10) for typical 1.8-ton farmer
Sustainability: LIRP automatically adjusts with living income benchmark updates
3. Continued shared responsibility contributions (inflation-adjusted):
Private sector maintains 58.26% contribution on the adjusted gap (not reduced percentage)
The gap is smaller because productivity gains + LIRP have lifted base income
Year 10 calculation:
Living income benchmark: $9,200 (inflation-adjusted)
Base income (productivity + LIRP): $7,335 ($5,850 cocoa + $1,485 diversification)
Remaining gap: $1,865/household (vs. $4,047 baseline gap)
Shared responsibility contribution: 58.26% of gap = $1,087/household
Annual pool: $1.32B (vs. $2.86B during fund years)
Result: Total income reaches $8,422/year (91.5% of inflation-adjusted benchmark)
The final 8.5% gap (approximately $778/household) is addressed through:
Continued government subsidy redirection ($327M/year sustained)
Additional productivity gains in highest-potential farms
Income diversification scaling beyond pilot areas (GALS + VSLA infrastructure remains)
Blended result: 100% living income achievement maintained
Why this works:
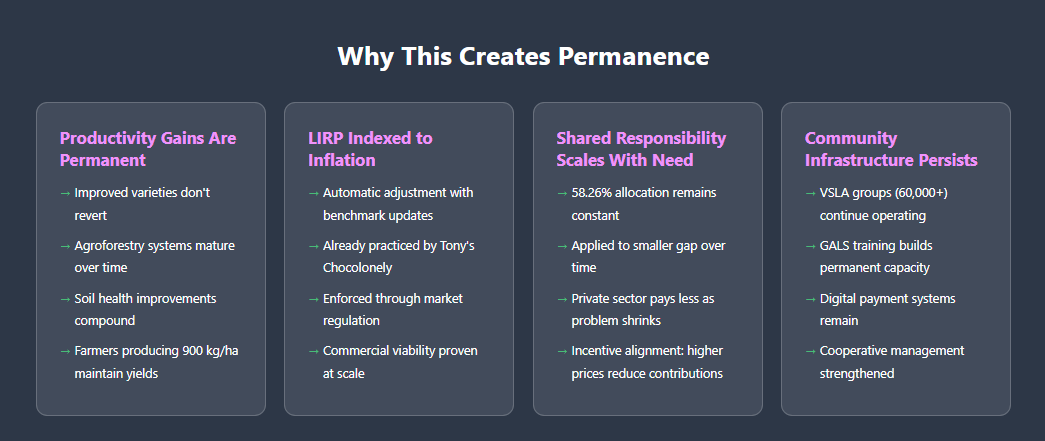
Productivity gains are permanent: Improved varieties, agroforestry systems, and soil health persist beyond the fund. Farmers producing 900 kg/ha don’t revert to 580 kg/ha.
LIRP indexed to inflation: Unlike fixed premiums, LIRP automatically adjusts with living income benchmark updates (already practiced by Tony’s).
Shared responsibility scales with need: The 58.26% allocation remains constant, but applies to a smaller gap as productivity and pricing reforms take effect. Private sector pays less in absolute terms ($1.32B vs $2.86B) because the problem is smaller, not because responsibility decreased.
Government sustainability: Subsidy redirection ($327M/year) is permanent reallocation of existing budget, not new spending. Digital payment infrastructure built during fund years reduces administrative costs.
VSLA and GALS infrastructure: Community savings groups and gender training create permanent local capacity for resilience and financial planning.
Distribution-weighted sustainability:
Farmers in different income bands maintain 100% achievement through different combinations:
Deep poverty band (0-40%): Largest productivity potential. Yields 580→1,000+ kg/ha + LIRP + shared responsibility supplements
Mid-income bands (41-80%): Moderate productivity gains + LIRP + smaller supplements + income diversification
Near-threshold band (81-99%): LIRP alone + modest productivity gains achieve 100%
Already above (100%+): LIRP ensures they stay above as benchmark rises
This isn’t a temporary program—it’s restructuring cocoa markets to internalize the true cost of production. The fund creates the conditions for permanence: higher productivity, mandatory living income pricing, maintained shared responsibility on adjusted gaps, and community-level financial infrastructure. By Year 10, the system sustains 100% living income achievement at 54% lower external financing than fund years, with continued reduction as productivity compounds.
CONCLUSION: From Fragmentation to Systems Change
This article has traced a journey from individual farmer households earning an average of $3,609/year (53% of the living income benchmark) to a comprehensive solution that brings all 1.2 million cocoa farming households to 100% of the $6,850 benchmark. The $49.1 billion fund uses a progressive, distribution-weighted allocation—recognizing that farmers sit on an income spectrum from deep poverty to near-threshold—to close every gap efficiently. The poorest third receive the largest supplements ($5,138/year), while those already near the benchmark receive smaller top-ups, ensuring 80% of the fund ($3.93B) delivers 100% living income achievement while the remaining 20% sustains these gains through productivity investments, forest protection, and administration. Here’s what makes this different from everything that came before:
The Three-Step Evolution
Fragmented premiums → Shared responsibility framework
From voluntary goodwill to calculated obligations
From company-by-company to science-based allocation
From 5% coverage to 100% potential
Shared responsibility → Sovereign-scale solutions
From millions (corporate CSR) to billions (debt-for-nature leverage)
From private-only to public-private partnership
From incremental to transformational
Premium programs → Parallel system approach
Keeps existing cocoa trade infrastructure unchanged (no disruption, no regulatory battles)
Creates parallel VSLA-based supplement delivery (proven model reaching 30M people globally)
100% farmer coverage from Year 1 (no waiting for market reform)
Builds capacity for permanent LIRP + productivity transformation by Year 10
This Fund can exist as a parallel delivery system that doesn’t touch cocoa trade:
The existing infrastructure continues unchanged—farmers sell to cooperatives at CCC-set farmgate prices, cooperatives deliver to exporters with licenses, forward contracts set prices months ahead, government regulates everything. No disruption. No regulatory reform battles. No political negotiations over price-setting formulas.
Meanwhile, living income supplements flow through an entirely separate channel: Village Savings and Loan Associations (VSLAs). Cash transfers directly to VSLA groups quarterly, distributed at regular community meetings with facilitator verification. This eliminates every failure point in the premium system: no individual mobile money accounts to expire, no cooperative cash flow dependencies, no exporter refusals, no coverage gaps. The Côte d’Ivoire government is already partnering with CARE to scale VSLAs (established 2025), and the model has proven effective for 30 million people across 15+ countries.
Result: The fund reaches 100% of farmers from Year 1 while simultaneously demonstrating the viability of living income payments, building VSLA infrastructure for long-term financial inclusion, strengthening cooperative capacity through management support, and creating political coalition for permanent LIRP reform by Year 10.
This isn’t just a different funding mechanism—it’s a different theory of change. Premium programs try to fix the payment system. The fund works around it while building the conditions for permanent transformation.
The Forward-Looking Principle
Throughout this article, I’ve emphasized a critical distinction: This framework focuses on solutions, not blame.
This framework doesn’t ask companies to pay for historical damages. Instead, it asks them to co-invest in:
Protection: Preventing future forest loss
Restoration: Regenerating degraded ecosystems
Living income: Ending current poverty and exploitation
Every dollar goes toward building a viable future, not compensating for the past. This is strategic: companies are more willing to invest in solutions than defend against liability claims.
What’s At Stake
The alternative to this transformation isn’t the status quo. It’s collapse:
Climate shocks intensifying: 11-20% production losses in 2023/24 will become routine
Farmers abandoning cocoa: Migration to cities accelerating
Supply chain instability: Cocoa shortages, price volatility
Regulatory tightening: EUDR just the beginning; living income mandates coming
Reputation collapse: Consumer backlash, NGO campaigns, investor pressure
The Call to Action
For Chocolate/Food Companies:
Calculate your shared responsibility allocation. Compare to current spending. Join the pooled fund or lead advocacy for its creation.
If you’re already paying LIRP: You’ve proven it’s viable. Now make it universal.
If you’re not: You’re free-riding on a broken system.
The competitive dynamics are clear: First-movers gain moral authority and eliminate their disadvantage when the playing field levels. Laggards face mounting reputation risk and eventual regulatory mandate.
For Governments:
Producer countries (Côte d’Ivoire, Ghana): Pursue debt-for-nature-income swaps. Create enabling environments for SPVs. Redirect subsidy leakage.
Consumer countries (EU, US, UK): Require shared responsibility contributions as import condition. Provide development finance for MDB co-financing. Facilitate debt relief.
For Civil Society & Consumers:
Demand transparency: “What is your shared responsibility allocation and are you paying it?”
Support systemic solutions over individual premiums. Understand that $1 more per chocolate bar, if universally applied, generates tens of millions in systemic change.
For Tony’s Open Chain & Mission Allies:
You’ve carried the torch. Now light the way.
Use your commercial success as proof. Your 5+ years of LIRP payments demonstrate viability. Your transparent impact reporting shows both successes and limitations. Only 19.1% reaching living income proves the need for systemic approaches.
Convene. Advocate. Demand. Push for regulations requiring shared responsibility. Build the coalition. Design the SPV. Negotiate with governments and MDBs.
You can’t solve this alone, but you can catalyze the solution.
A Vision for 2035
Imagine:
1.5 million Ivorian cocoa farmers earning at or above living income
500,000 hectares of forest protected, 150,000 restored
Child labor reduced by 80%, school enrollment at 95%
A replicable model extended to Ghana, then Colombia (coffee), Ethiopia (coffee), Indonesia (palm oil)
5 million farming households globally benefiting from shared responsibility frameworks
Agricultural trade redefined: Living incomes embedded, deforestation economically uncompetitive
This isn’t utopian. It’s achievable with the right mechanisms:
Debt-for-nature swaps (proven: Belize, Ecuador, Gabon)
Shared responsibility allocation (proven: palm oil research framework)
Digital payment systems (proven: Kenya M-Pesa, Ghana mobile money)
The tools exist. The evidence is clear. The path is mapped.
The first-movers have shown it’s commercially viable. The research has shown it’s calculable and fair. The financing mechanisms have shown it’s scalable.
Now it’s time to build it.
Will implementation be messy? Undoubtedly. Payment delays, coordination failures, and learning curves are inevitable. But these challenges pale against the alternative: a system where exporters captured windfall profits while farmers’ incomes declined during price surges. Every inefficiency becomes a learning. Perfection isn’t the standard—progress is.
Connect with Dan if this is something you are working to achieve www.linkedin.com/in/dan-fullem or directly at danfullem@gmail.com
What are your thoughts on shared responsibility for living income in agricultural supply chains? Have you seen examples of pre-competitive collaboration that actually worked at scale? Share your experiences and questions in the comments.
And if you’re working in cocoa, coffee, palm oil, or any agricultural commodity supply chain: let’s talk. The transformation starts with conversations like these.
Author’s Note: This framework builds on groundbreaking research by Pasaribu et al. (Copenhagen Business School, Lafayette College, University of London) published in the Journal of Cleaner Production, 2025, and data generously shared by Tony’s Open Chain in their 2024 Impact Report. The financial structure draws from successful debt-for-nature swaps executed by The Nature Conservancy, Credit Suisse, and development finance institutions globally.
Special thanks to the researchers, practitioners, and farmer cooperatives whose work makes articles like this possible.
Footnotes
Tony’s Chocolonely 2025 Impact Report, reporting 40.6% of farmers in three long-term partner cooperatives reached or exceeded the living income benchmark for Côte d’Ivoire in 2024/25, up from 19.1% in 2023/24
Trade for Development Centre, “Côte d’Ivoire and Ghana: Strong growth in farm-gate cocoa prices,” October 17, 2025. President Alassane Ouattara announced the farmgate price increase to 2,800 CFA francs/kg on October 1, 2025, a 56% increase from the previous season’s 1,800 CFA francs/kg
CNBC Africa, “Ivory Coast regulator launches programme to buy cocoa stocks from farmers,” January 2026. “Exporters have refused to buy beans at the guaranteed price of 2,800 CFA francs/kg after a fall in global cocoa prices”
News Ghana, “Côte d’Ivoire Cocoa Crisis Deepens With 123,000 Tonnes Unsold,” February 2026. Reports farmers being forced to sell at 2,000 CFA/kg despite official government price of 2,800 CFA/kg, with up to 123,000 tonnes unsold
Hütz-Adams et al., “Strengthening the Competitiveness of Cocoa Production,” Südwind, 2016
Arora, “Top-10 Cocoa Producing Countries in the World 2024,” May 2024
Mighty Earth, “Sweet Nothings: How the Chocolate Industry has Failed to Honor Promises to End Deforestation for Cocoa in Côte d’Ivoire and Ghana,” February 2022
Ibid.
NORC, “Assessing Progress in Reducing Child Labor in Cocoa Production,” 2020
Tony’s Open Chain, “Impact Report 2024,” pages 36-38
Tony’s Open Chain Impact Report 2024, page 35. Price converted from EUR to USD at 1.09 exchange rate.
Living Income benchmark updated from Tony’s Chocolonely 2025 Impact Report (4,179,102 XOF/year ≈ €6,371/year). Original 2022 Anker methodology: Anker & Anker, “Living Income Benchmark Update: Côte d’Ivoire and Ghana,” June 2022.
Habraken, R., Kuijpers, R. and Diallo, O. (2025) “Resilience during cocoa sector turbulence. Progress report of the Nestlé Income Accelerator Program,” KIT Royal Tropical Institute, Amsterdam. Program impacts based on 30-month evaluation of test-at-scale phase covering 9,401 households in Côte d’Ivoire. Yields, revenue, VSLA membership, savings, food insecurity, and women’s empowerment results from econometric analysis comparing program participants to matched comparison group.
Habraken et al. (2025), ibid. Econometric analysis using two-way fixed effects regression models showed statistically significant positive relationships between cash transfer amounts received and multiple outcomes including farm investments (p<0.001), productive asset index (p<0.001), adaptive capacity (p<0.05), VSLA savings (p<0.10), food security (p<0.10), and women’s empowerment (p<0.001).
Habraken, R., Diallo, O., and de Graaf, L. (2025) “EnRoute Endline Evaluation Final Report,” KIT Royal Tropical Institute, Amsterdam. Randomized controlled trial across 599 households in Daloa and Man regions, Côte d’Ivoire (2023-2025). Cash Only package increased school expenditure 272% (p<0.01). Cash & Services package showed statistically significant impacts across 11 outcome domains including cocoa production, household income, financial inclusion, women’s empowerment, and adaptive capacity.
Tony’s Chocolonely 2025 Impact Report, pages 53-54, 58. Child labor prevalence at long-term partner cooperatives (harvesting stage): 3.9% vs. industry average ~50% (NORC 2020). This dramatic reduction was achieved through comprehensive CLMRS implementation, LIRP payments, long-term commitments (5+ years), and community infrastructure support (schools, water, healthcare) funded by the Chocolonely Foundation (1% of Tony’s annual revenue). The report notes: “The prevalence rate development indicates that a significant reduction in child labour cases is observed as Tony’s Open Chain continues collaborating with partner cooperatives over time.”
International Cocoa Initiative (2025) “How gender equality and financial inclusion shape the impacts of cash transfers: Research Report,” ICI, Geneva. Study conducted in partnership with Nestlé across 79 cocoa-growing communities in Ghana (2023-2025), testing whether cash transfers have different impacts when paid to women vs. men, and how combining cash with GALS and VSLA changes outcomes.
ICI (2025), ibid. Quantitative analysis showed cash transfers significantly improved gender equality in decision-making (p<0.05), with stronger effects when directed to women compared to men (statistically significant difference). Combining cash with GALS and VSLA had significantly stronger effects on equitable household decision-making compared to cash alone (p<0.01). Women receiving cash + GALS + VSLA showed improvements in decision-making power, financial independence, and social status.
Carlson et al., “Effect of Oil Palm Sustainability Certification on Deforestation and Fire in Indonesia,” PNAS, 2018; Heilmayr et al., “Deforestation Spillovers from Oil Palm Sustainability Certification,” Environmental Research Letters, 2020
Ingram et al., “The Impacts of Cocoa Sustainability Initiatives in West Africa,” Sustainability, 2022
Pasaribu et al., “A method for estimating buyers’ shared responsibility for oil palm expansion,” Journal of Cleaner Production, 2025
Benedict et al., “Indonesia Palm Oil (2021-2022),” Trase, 2024; Pasaribu, K., Gallemore, C., Jespersen, K., & Delabre, I. (2025). “A method for estimating buyers’ shared responsibility for oil palm expansion.” Journal of Cleaner Production, 497, 145164. https://doi.org/10.1016/j.jclepro.2025.145164
The $7.7B debt restructuring combines three mechanisms, with interest rates based on successful debt-for-nature swap precedents (Belize 2021, Ecuador 2023, Gabon 2023): (1) Bilateral debt ($3.4B from Paris Club creditors): ~50% forgiven ($1.7B write-off), remaining $1.7B converted to 2.5% concessional rate over 20 years, yielding ~$110M/year savings. (2) Commercial debt ($3.2B Eurobonds): Third-party conservation financiers (e.g., TNC, USAID DFC, IFC) purchase at 55% discount ($1.44B upfront as blue bond); Côte d’Ivoire repays $1.44B at 5.5% over 18 years (matching Ecuador’s 5.645% Galapagos Bond precedent) with DFC/IFC political risk insurance providing Aa2 credit enhancement, yielding ~$135M/year savings. (3) Multilateral debt ($1.1B from IFIs): Refinanced at 3.5% over 25 years (IBRD terms for lower-middle income countries; Côte d’Ivoire not IDA-eligible), yielding ~$68M/year savings. Total annual debt service relief: approximately $313M/year plus $148M/year from grace periods and extended maturities = $461M/year total. This structure follows proven blue bond precedents while maintaining creditworthiness and avoiding balloon payments. Assumes 9% original weighted average rate (market rate for Ivorian sovereign debt), 10-year original weighted maturity. The $1.44B upfront blue bond financing is sourced from institutional investors attracted by DFC insurance (as in Ecuador), with proceeds used for commercial debt buyback.
MDB co-financing of $496M/year represents a 10-year coordinated financing facility ($4.96B total commitment) structured under the debt-for-nature framework, not annual discretionary grants. This more conservative scale (reduced from initial $794M estimate) improves defensibility while maintaining precedent-based viability. The amounts assume: (1) IDA allocation ($248M/year) as part of broader Côte d’Ivoire agricultural development program with staggered multi-year disbursements (now ~1.1% of Africa allocation vs 1.8%); (2) AfDB commitment ($174M/year) building on their quintupled partnership growth (€448M in 2015 → €2.317B in 2024), now ~7.5% of CI portfolio vs 12%; (3) IFAD co-financing ($74M/year) alongside WB/AfDB as coordinating agency (now ~3% of global budget vs 5%). Still ambitious at 2-3x typical single-country programs, but comparable to coordinated regional initiatives (AfDB’s SAPZ: $1.1B across multiple countries; CGIAR global: ~$1B/year across 70+ countries). Annual disbursements would ramp up over the 10-year period rather than front-loaded.
Bilateral contributions of $198M/year (reduced from initial $496M estimate) assume coordinated “Team Europe” approach under the EU Global Gateway initiative, treating Côte d’Ivoire living income + deforestation as a flagship sustainable development program. This more conservative allocation improves defensibility: EU amount ($109M/year, was $273M) now requires less aggressive NDICI-Global Europe programming tied to EU Deforestation Regulation compliance; UK FCDO ($50M/year, was $124M) now represents ~0.3% of UK aid budget vs 0.8%, more feasible as leveraged co-financing through multilateral channels; France/Germany/Netherlands ($39M/year combined, was $99M) represents more realistic scaled-up commitments from established Côte d’Ivoire development partners. Total $198M/year is now 2-4x typical bilateral agricultural programs (rather than 5-10x), more defensible as coordinated response to dual living income + climate crisis affecting Europe’s primary cocoa supplier. Disbursements structured as blend of grants, concessional loans, and guarantee facilities rather than cash transfers.
 | A guest post by
|
This is one of the most detailed reports on the cocoa industry I've ever read.